Panel Makers’ Q2 2026 Earnings: Sharp Returns to a Profit but Downgrades Forecast; HannStar Books Profit on Extraordinary Gain
0
August 11, 2026
Sharp and HannStar reported Q2 2026 financial results last week, and both companies bounced back from Q1 2026 losses to book profits in the second quarter. However, both companies exposed weak points as Sharp lowered its fiscal year profit forecast and HannStar continued to report operating losses.
Sharp
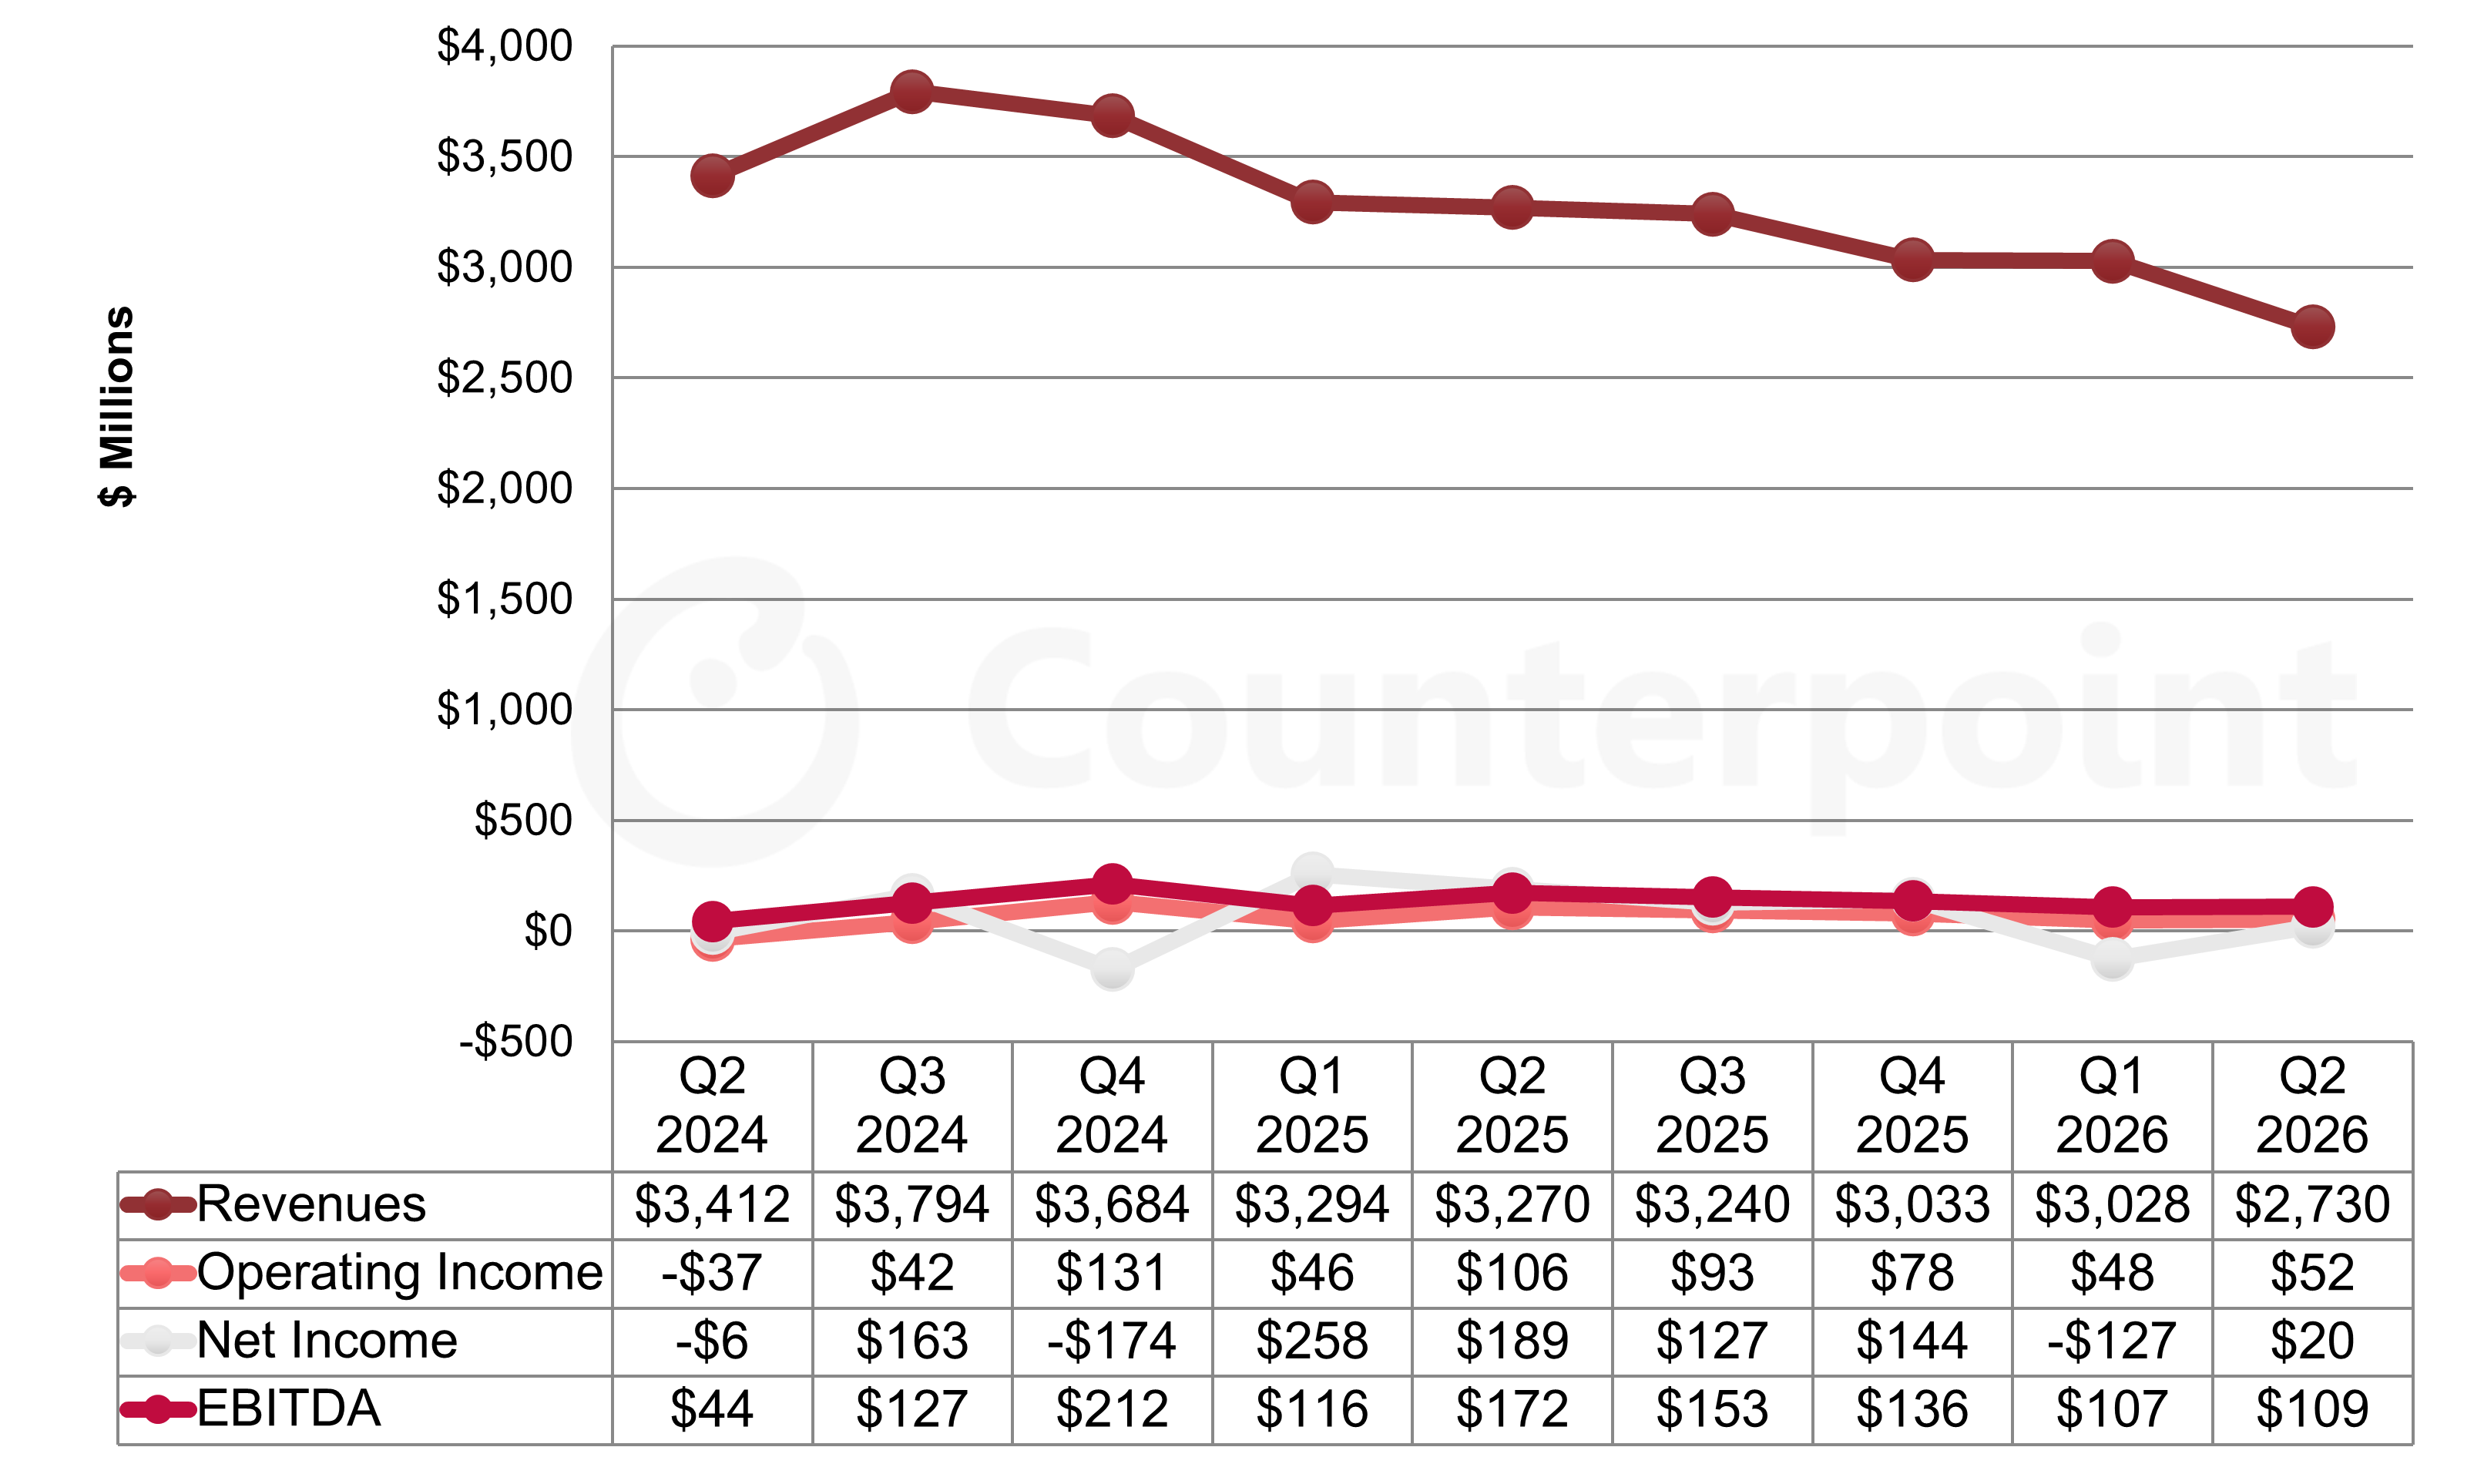
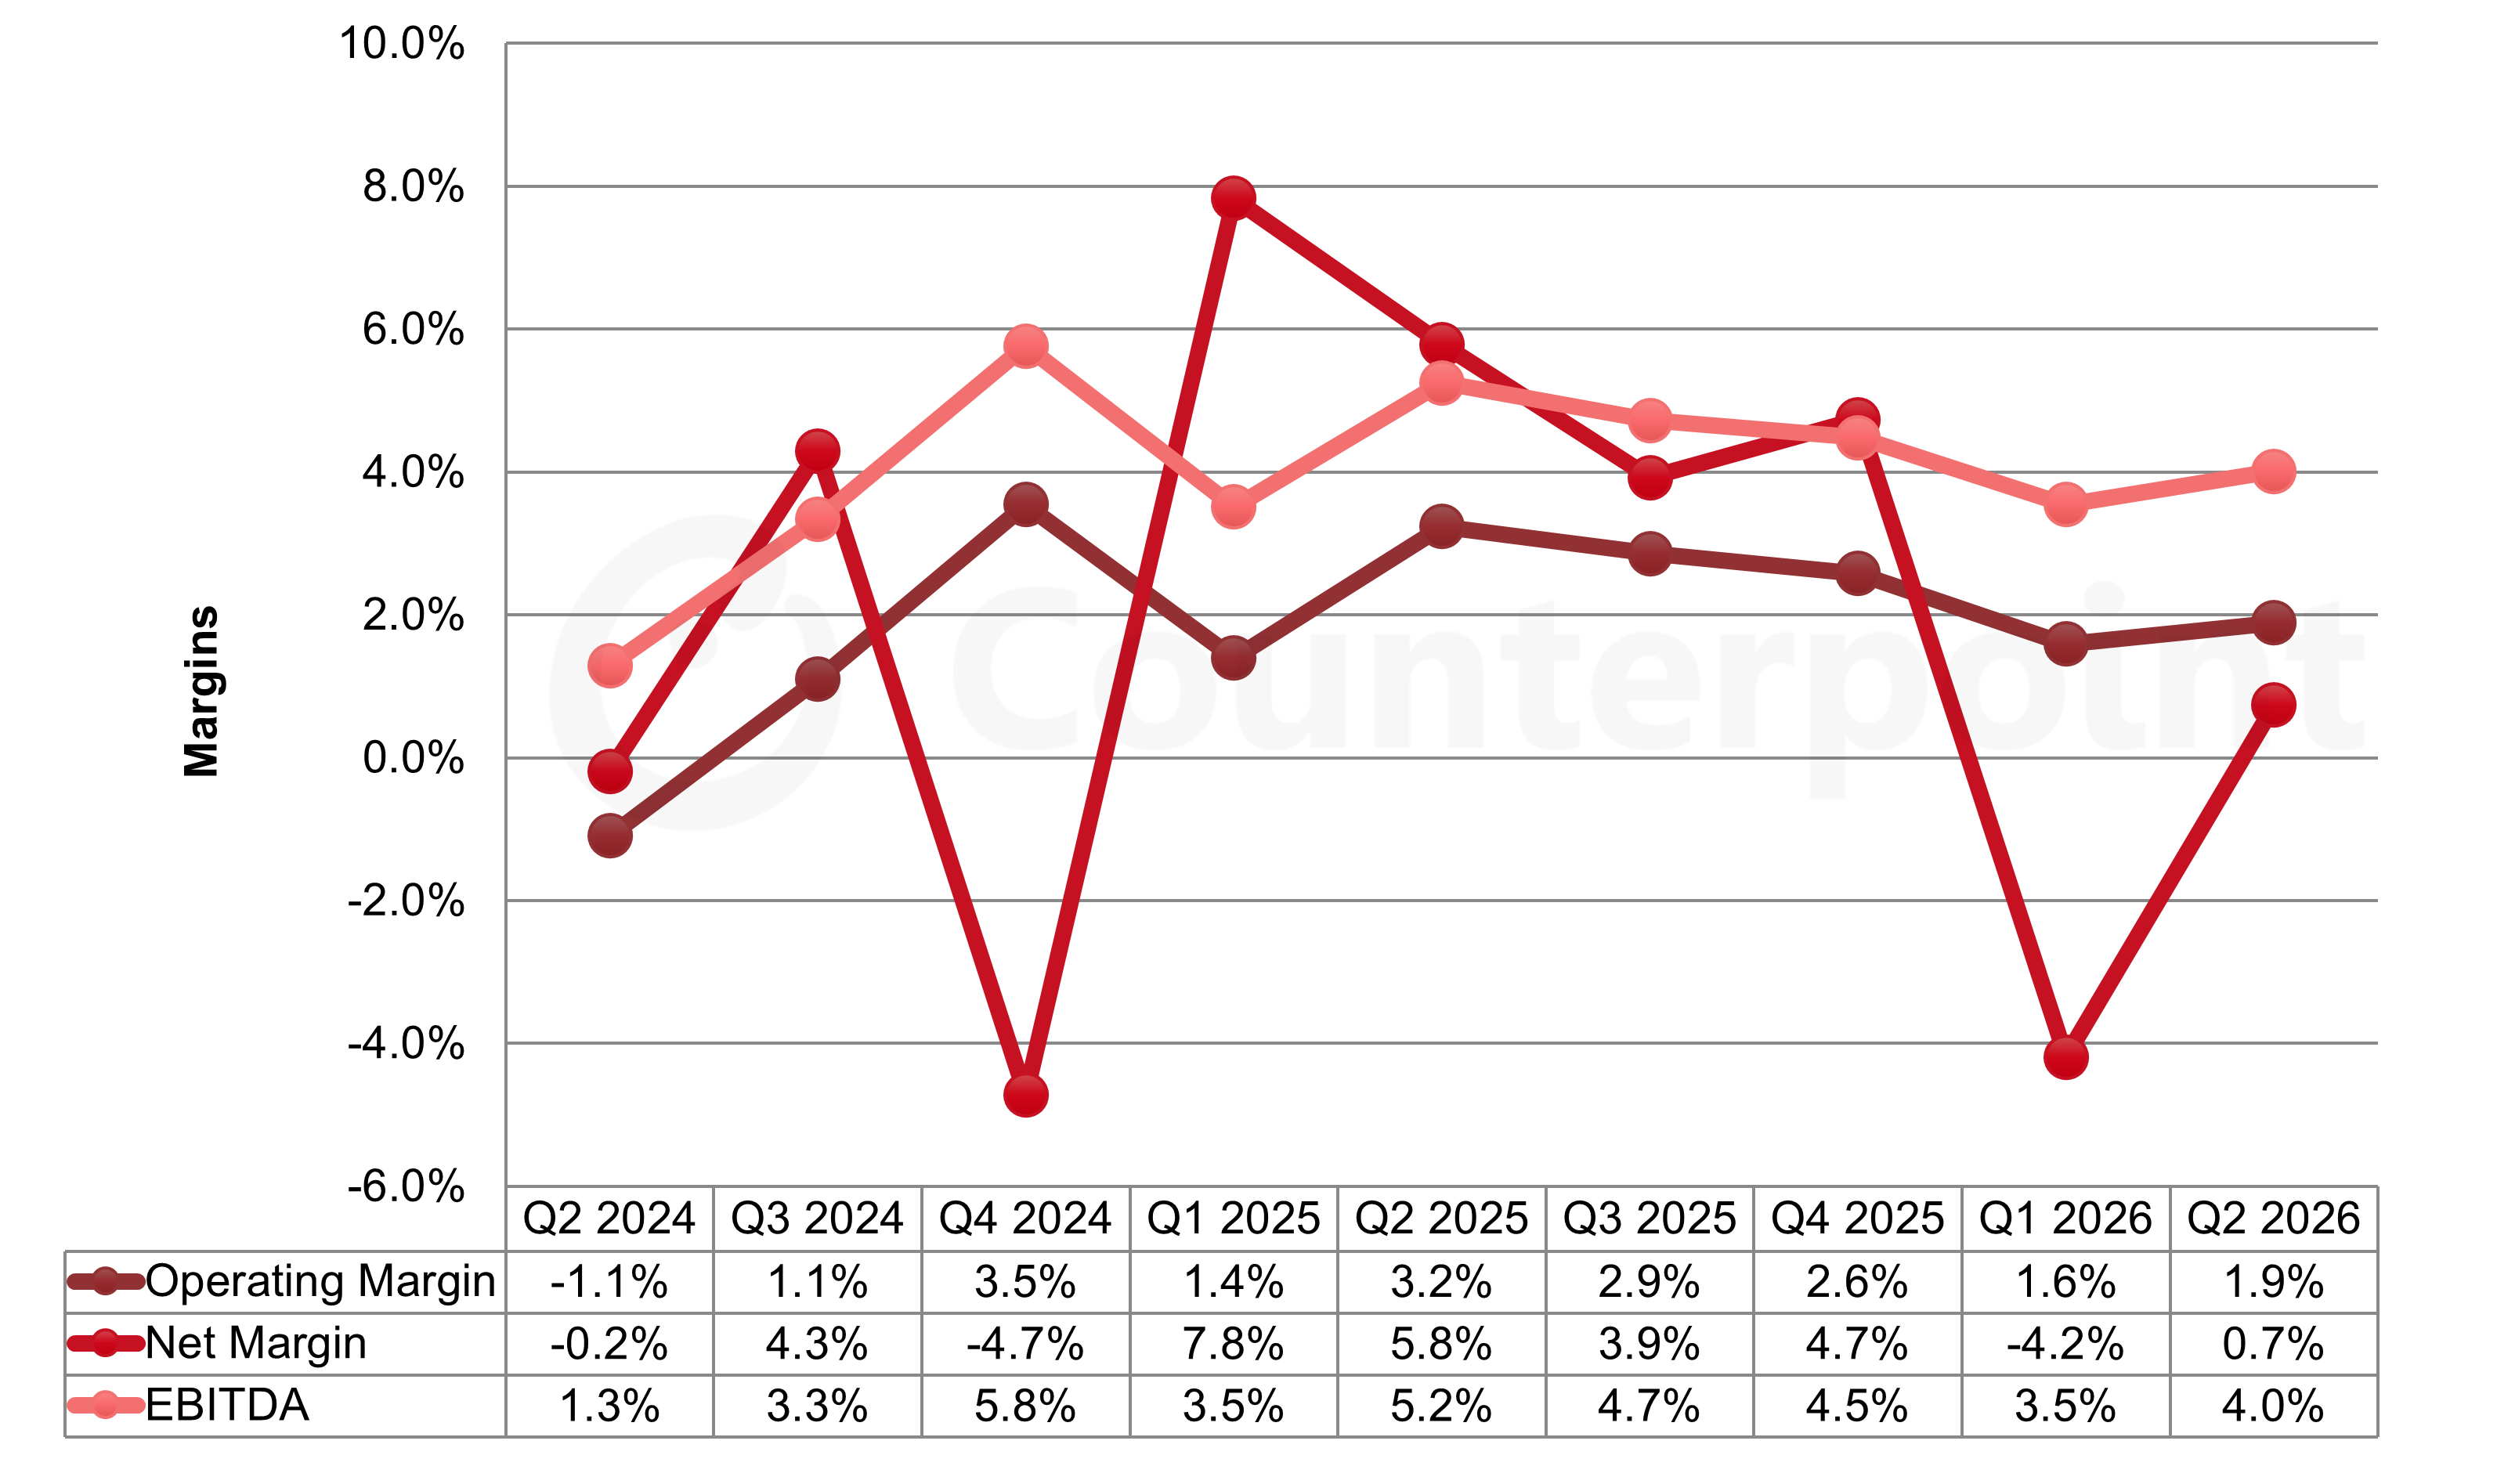
Sharp Corporation reported a calendar Q2 2026 net profit of JPY 3.2 billion ($20 million) on revenues of JPY 435 billion ($2.7 billion). Revenues narrowly beat consensus expectations of JPY 433 billion, but net income fell short of consensus expectations of JPY 4.7 billion. Revenues were down 10% QoQ and 17% YoY, and the net profit compares to a net loss of JPY 19.9 billion in Q1 2026 and a net profit of JPY 27.3 billion in Q2 2025.
Sharp’s operating profit of JPY 8.2 billion ($52 million) in Q2 2026 was up 7% QoQ but down 51% YoY. The company reported a net non-operating loss of JPY 1.6 billion pre-tax, with the biggest-portion net interest of JPY 2.9 billion. Sharp reported a net extraordinary loss of JPY 1.1 billion, including JPY 0.5 billion in restructuring.
Sharp Quarterly Income Statement Highlights
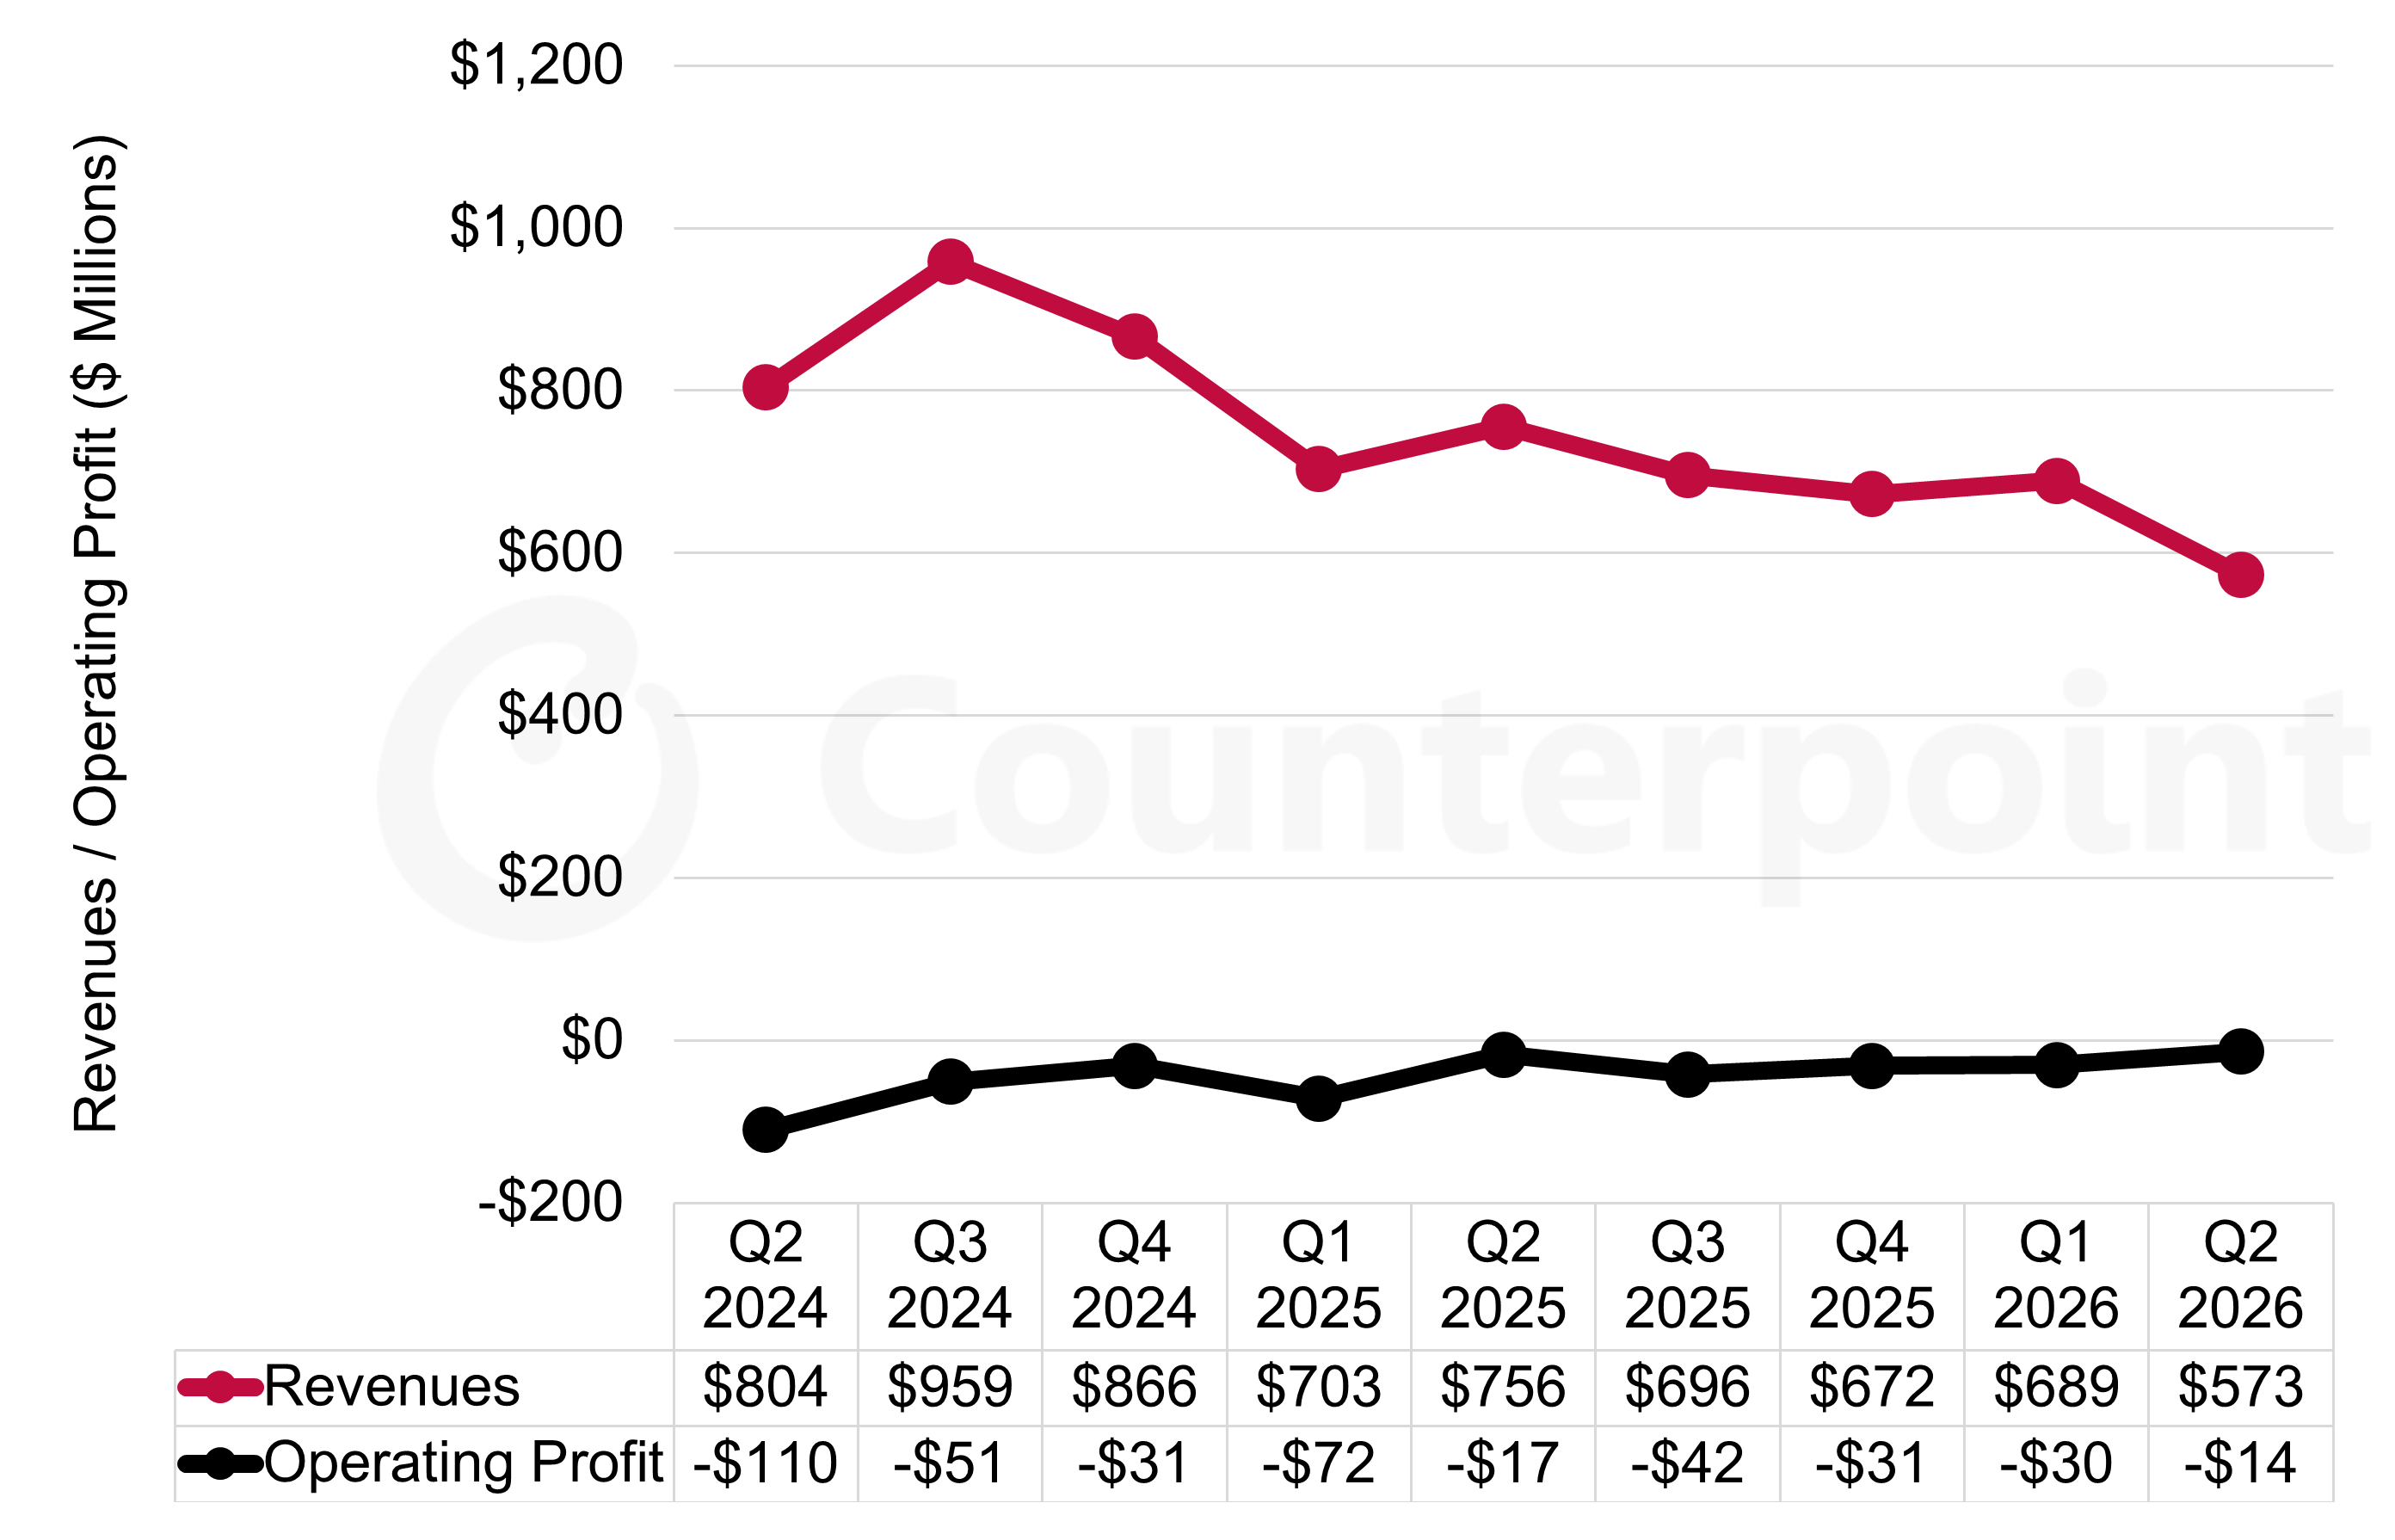
Sharp’s Display Devices business segment recorded an operating loss of JPY 2.2 billion ($14 million) in Q2 2026, compared to a loss of JPY 4.8 billion in Q1 2026 and a loss of JPY 2.5 billion in Q2 2025. Revenues for Display Devices were JPY 91.3 billion ($573 million), a decrease of 17% QoQ and 24% YoY in $ terms.
The Display Device operating margin was -2.4%, an improvement compared to -4.4% in Q1 2026 but comparable to -2.3% in Q2 2025. For Display Devices, Q4 2025 represented the sixteenth consecutive quarter of operating losses, which have totaled JPY 212 billion during that time.
Performance of Sharp’s Display Device Business Segment
Sharp’s debt increased 7% QoQ in $ terms but decreased 14% YoY. Equity increased 1% QoQ and 7% YoY. Debt/equity increased QoQ from 329% to 348%, but net debt/equity decreased from 139% to 133%.
Sharp reported negative operating cash flow of JPY 19.5 billion ($122 million) in Q2 2026 and negative free cash flow of JPY 24.5 billion ($154 million). Capital expenditures in display stood at JPY 0.8 billion ($5 million).
Sharp revised its results forecast for this financial year (ending March 31, 2027), originally issued in May 2026. The forecast assumes an exchange rate of JPY 160/$ (was 156/$).
Net sales are expected to reach JPY 1,770 billion (unchanged), a decrease of 7% YoY.
Operating profit is expected to be JPY 30 billion (was JPY 49 billion), a decrease of 38% YoY.
Net profit is expected to be JPY 25 billion (was JPY 42 billion), down 47% YoY.
Display Device revenue is expected to be JPY 304 billion (was JPY 323 billion), down 28% YoY.
Display Device operating profit is expected to be a loss of JPY 12 billion (was JPY 6 billion), an improvement from the JPY 18.2-billion loss in fiscal 2025.
Capex is expected to be JPY 39 billion (unchanged), an increase of 27% YoY, of which JPY 10 billion will be display capex, a decrease of 6% YoY.
HannStar
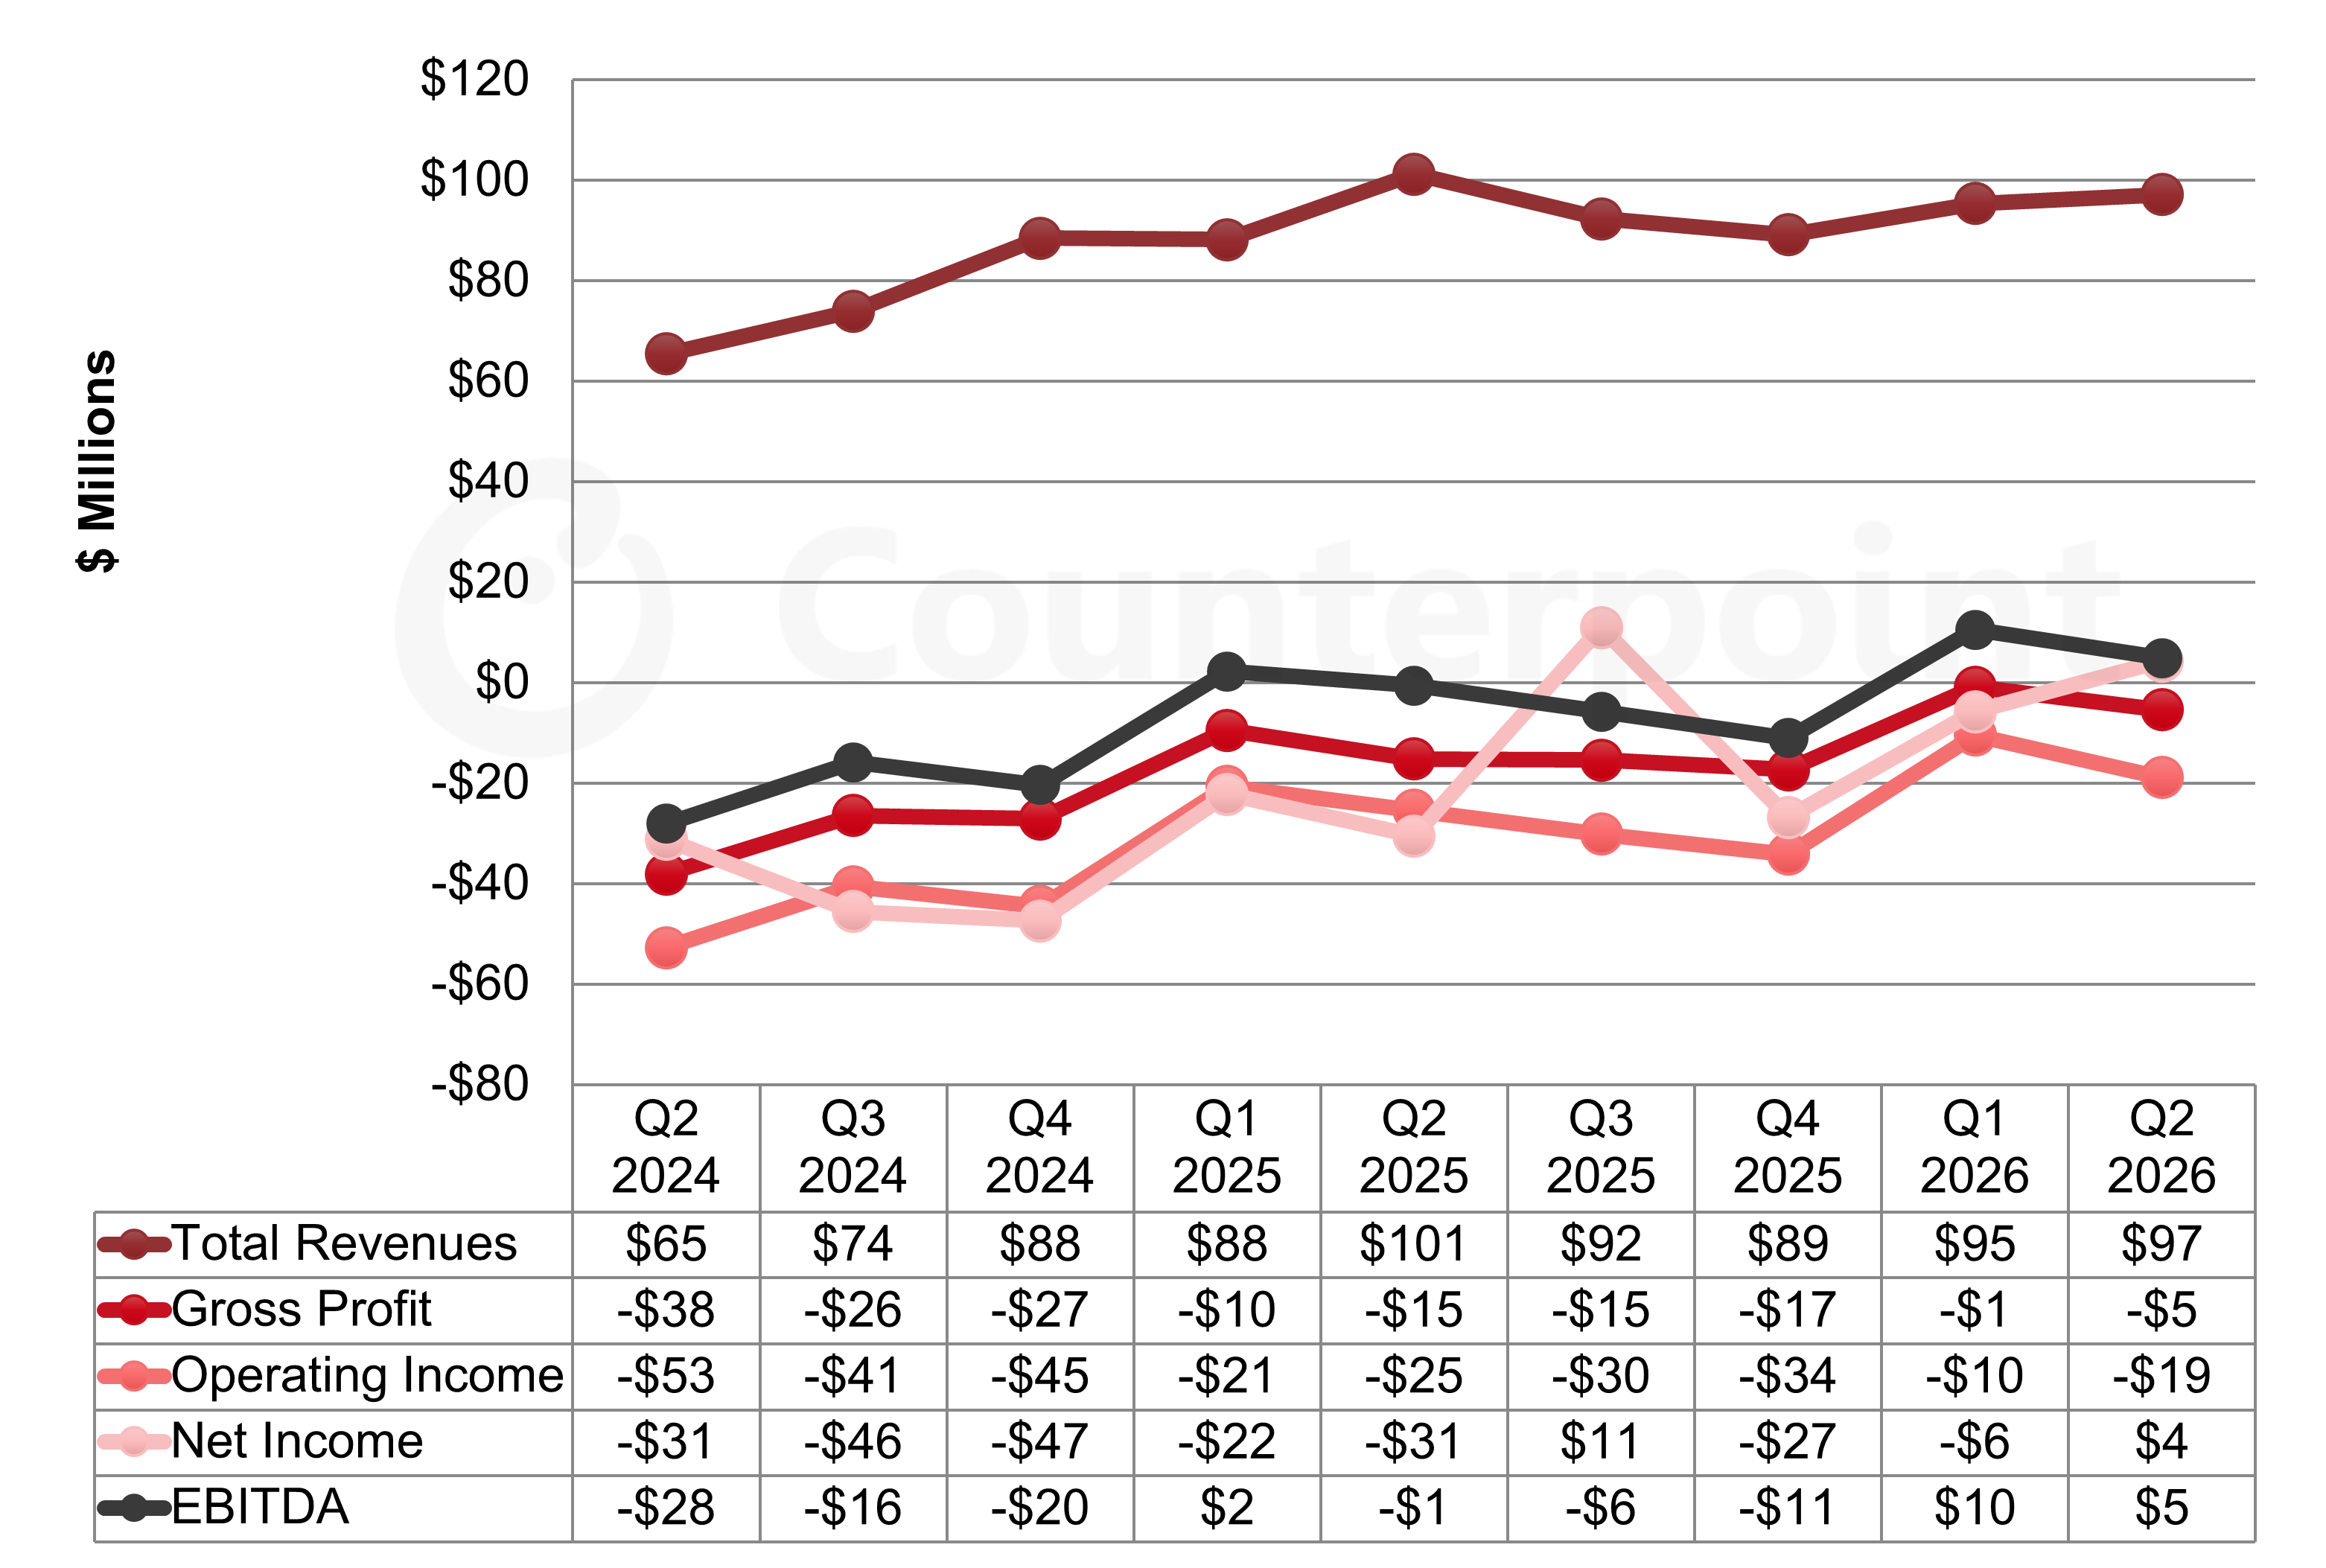
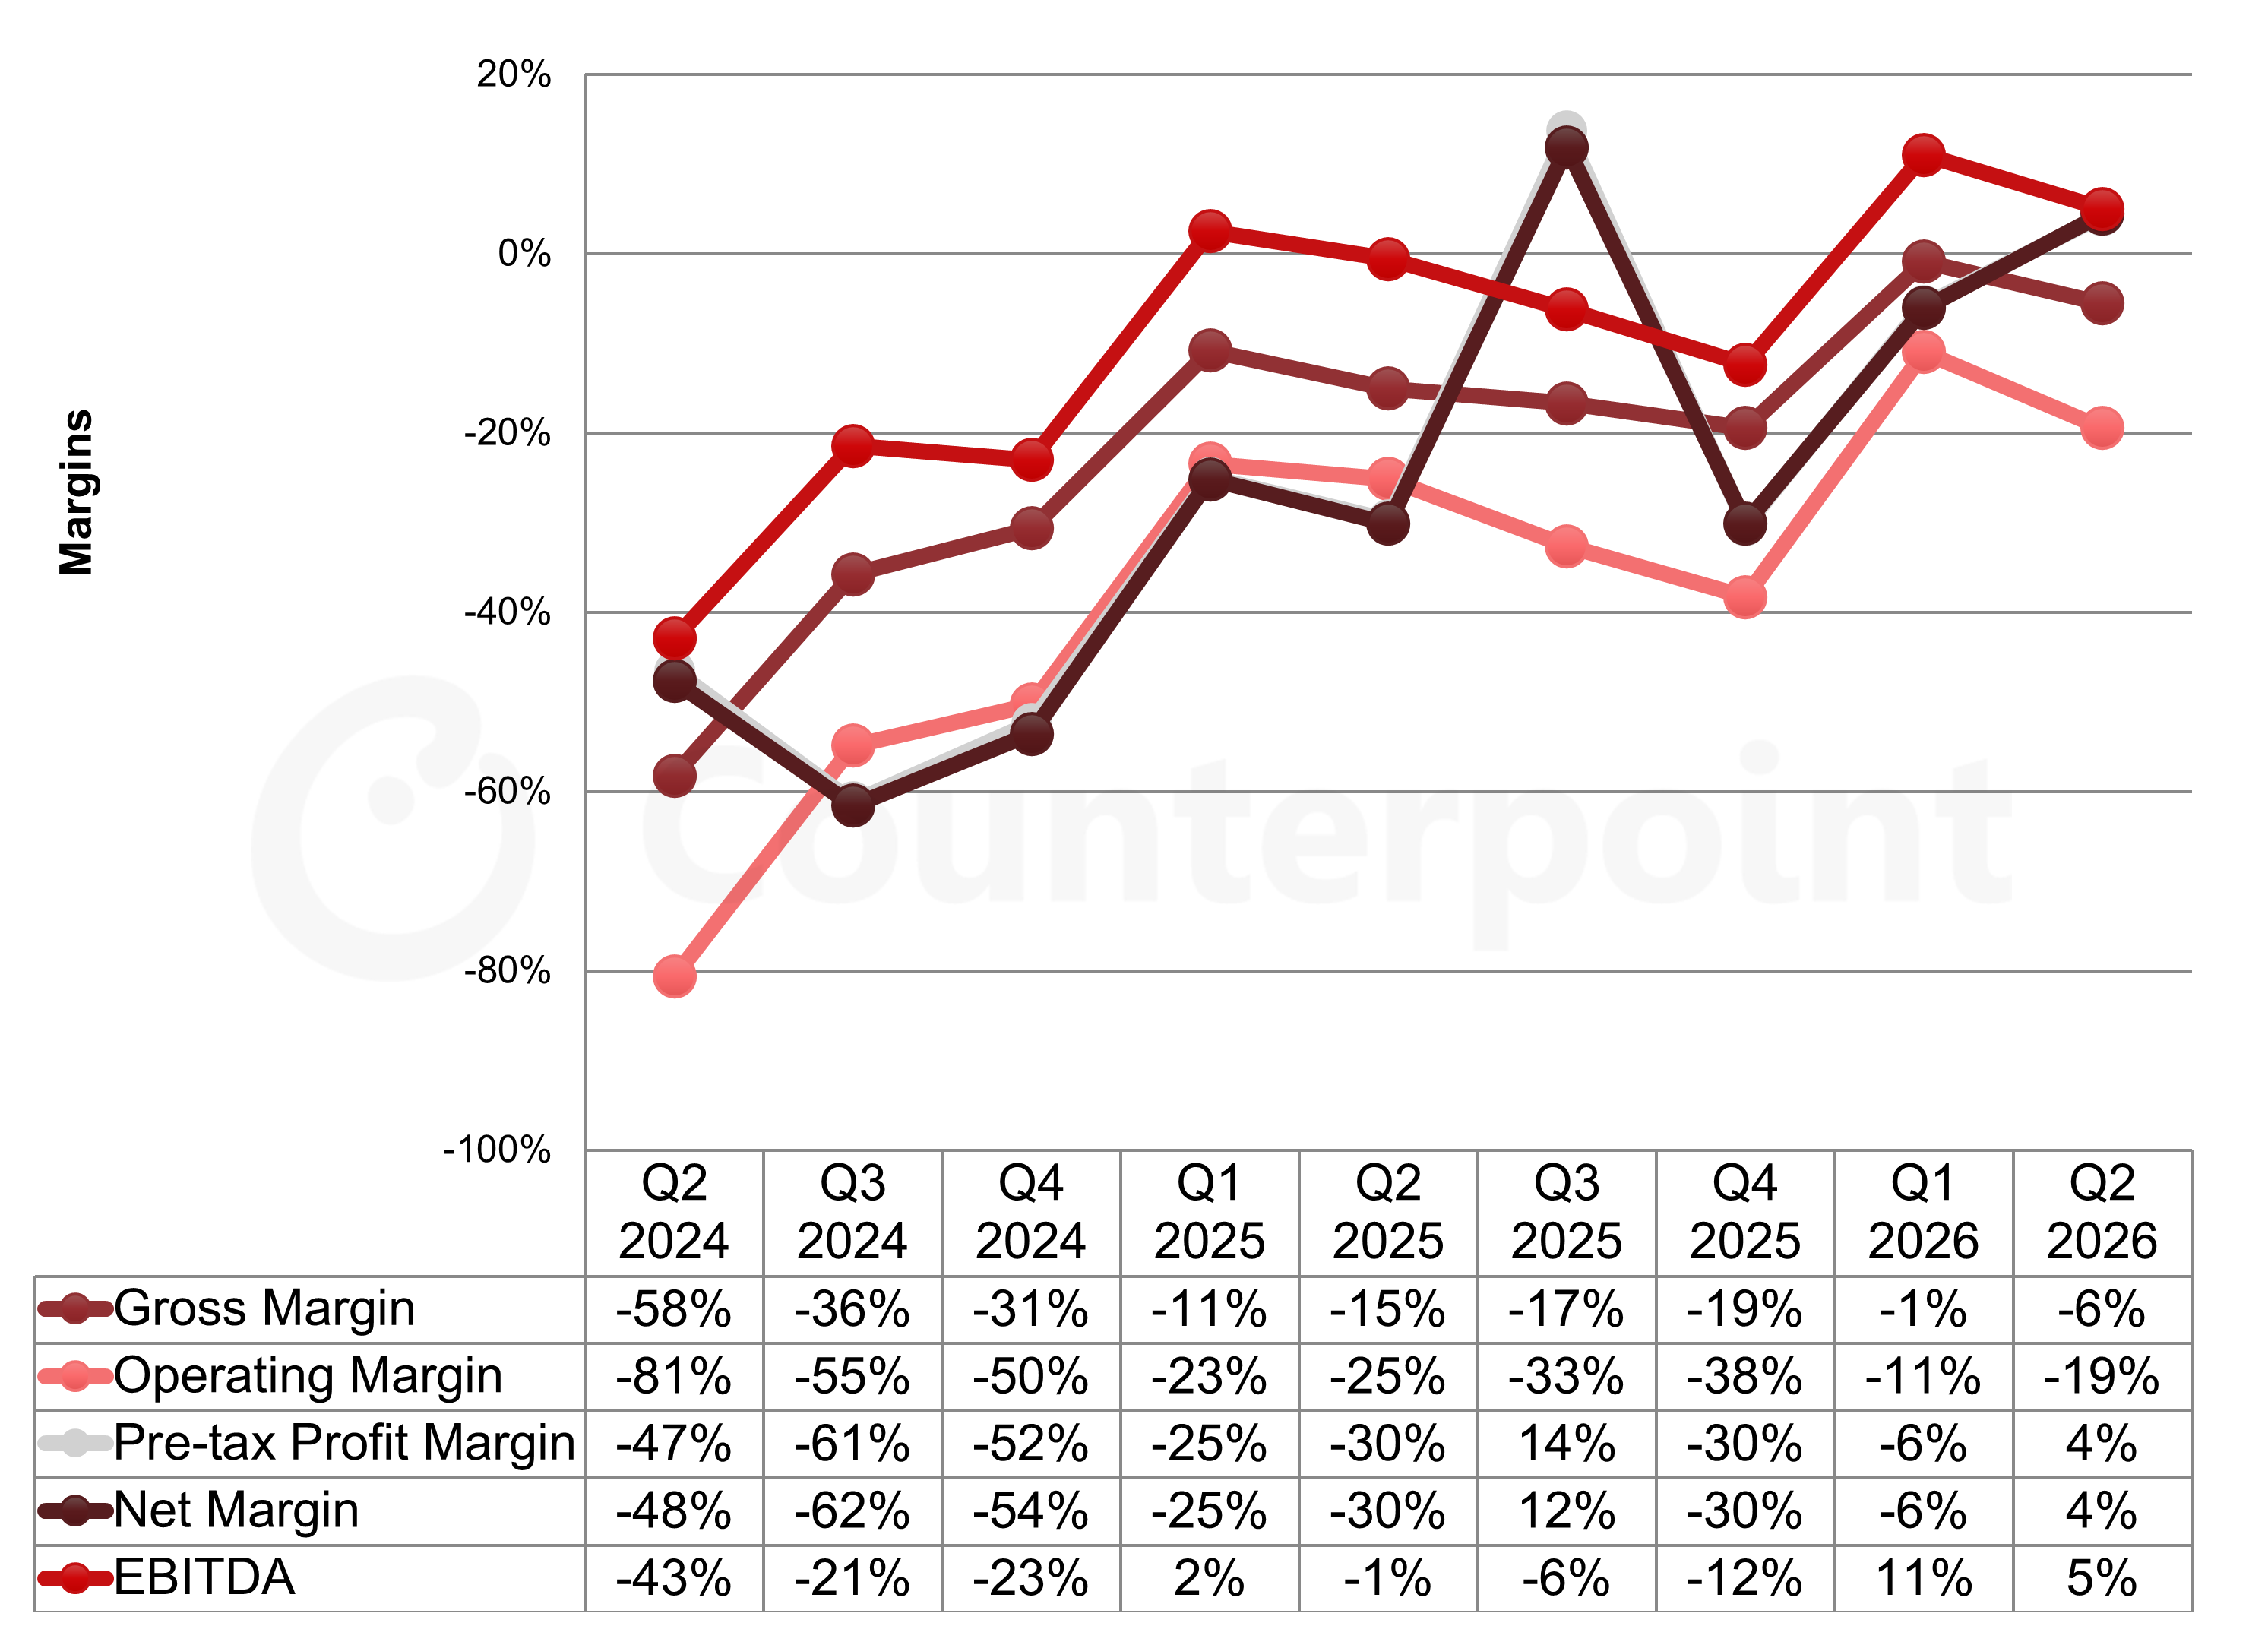
HannStar reported a net profit of NT$137 million ($4 million) on revenues of NT$3.1 billion ($97 million). The company’s revenues were up 2% QoQ but down 4% YoY in $ terms. The net profit compares with a net loss of NT$183 million ($6 million) in Q1 2026 and a net loss of NT$905 million ($31 million) in Q2 2025.
HannStar reported an operating loss of NT$597 million ($19 million), which compares to an operating loss of NT$331 million in Q1 2026 and an operating loss of NT$754 million in Q2 2025. The company reported an extraordinary profit of NT$727 million but did not disclose the reason. HannStar has now reported a net loss in 14 of the last 16 quarters, and an operating loss in 16 consecutive quarters.
HannStar reported positive EBITDA of NT$154 million ($5 million). It has reported positive EBITDA in only 3 of the last 15 quarters. Gross, operating, net and EBITDA margins all worsened QoQ by between 5% and 8%, but net margin improved by 10% QoQ with the extraordinary gain.
HannStar Quarterly Income Statement Highlights
In Q2 2026, HannStar area shipments decreased by 4% QoQ and 14% YoY to 3.02 million of 19” equivalents. The 19” panel size is equivalent to 0.112 square meters, so area shipments were equivalent to 0.338 million square meters. ASPs per 19" equivalent were up 7% QoQ and 19% YoY to $32, the highest level since Q1 2024. Area ASP is equivalent to $286 per square meter.
Product mix shifted toward smaller panels. Revenues for <6" panels increased by 24% QoQ and 12% YoY and represented 28% of revenues. Revenues for 6.2-10.1" panels decreased by 6% QoQ and 9% YoY and represented 57% of revenues, while revenues for 11"+ panels increased 2% QoQ but decreased 10% YoY and represented 15% of the total. Small and medium unit shipments decreased 10% QoQ and 2% YoY to 64.2 million in Q2 2026.
HannStar's balance sheet and cash flow statement were unavailable as of August 7, 2026.
Category
Industry
Display
Service
Display Market Trends
Report Type
Report
Time Period
Weekly
Receive our insightful weekly newsletter and stay ahead of the competition.
Author
Bob Obrien
Robert J (Bob) O’Brien joined Counterpoint Research as part of its acquisition of DSCC, where he was Co-Founder, Principal and CFO of DSCC. Bob has decades of experience turning market and business analysis into strategic insights in the display and electronics industries. At DSCC, Bob takes the lead role in analysis of display materials, including glass and AMOLED materials, and covers developments in TV and other large-screen display applications. He is the principal author of DSCC’s AMOLED Material Report, the Advanced TV Shipment Report, and the Display Glass Report, and Bob contributes regularly to the DSCC Weekly Review.