Panel Maker Earnings: LGD Slips to a Loss in Slow Q2 2026
LGD has improved its operating efficiency substantially in the last two years by cutting costs and refining its product portfolio. The company managed to earn a small operating profit even with the typical seasonal downturn in Q1 2026 but fell to an operating loss in Q2 2026 as revenues slumped further with an unfavorable product mix. Restructuring charges and interest payments on the company’s heavy debt burden, much of which is in US dollars, pulled its net results down to another significant loss.
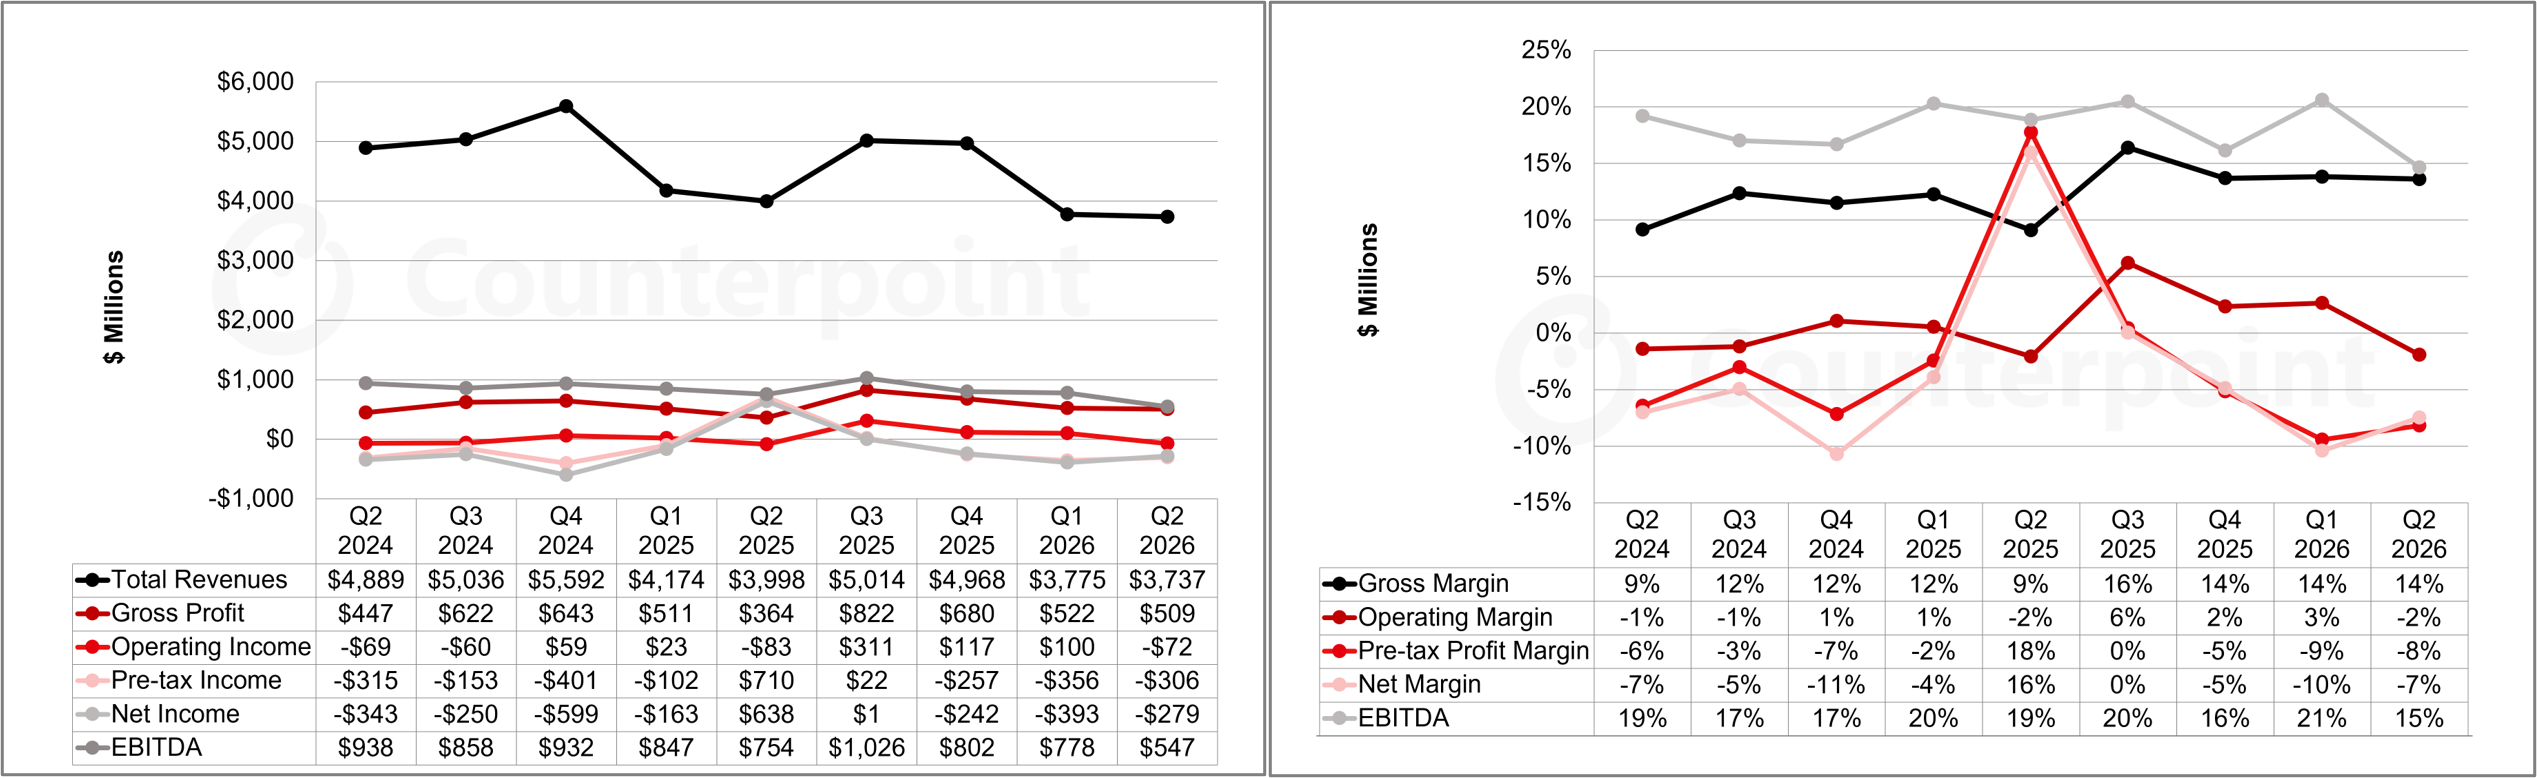
LGD reported a net loss of KRW 419 billion ($279 million) on revenues of KRW 5.6 trillion ($3.7 billion). Revenues were down 1% QoQ and 7% YoY in US dollar terms. The South Korean won depreciated 2.4% QoQ and 7% YoY against the US dollar.
LGD reported an operating loss of KRW 108 billion ($72 million), its first after three profitable quarters. The Q2 2026 operating loss compared to an operating profit of KRW 147 billion in Q1 2026 and an operating loss of KRW 116 billion in Q2 2025.
LGD's pre-tax loss was KRW 459 billion ($306 million). The KRW 351 billion delta from operating results is from interest expense and non-operating losses. LGD incurred KRW 240 billion of one-off expense from voluntary retirement packages in Q2 2026.
Revenues beat consensus estimates by 2%, but net income was worse than expectations of a loss of KRW 224 billion. Operating income was worse than consensus expectations of a loss of KRW 54 billion. The EBITDA profit of KRW 821 billion (+$661 million) was worse than the consensus EBITDA profit of KRW 992 billion.
Gross margin was flat QoQ and up 3% YoY, operating margin was down 5% QoQ and flat YoY, and EBITDA margin was down 6% QoQ and 4% YoY. Net margin was -7%, compared to -10% in Q1 2026 and +16% in Q2 2025 when LGD recognized gains from selling its Guangzhou LCD fab to China Star.
LG Display Quarterly Income Statement Highlights
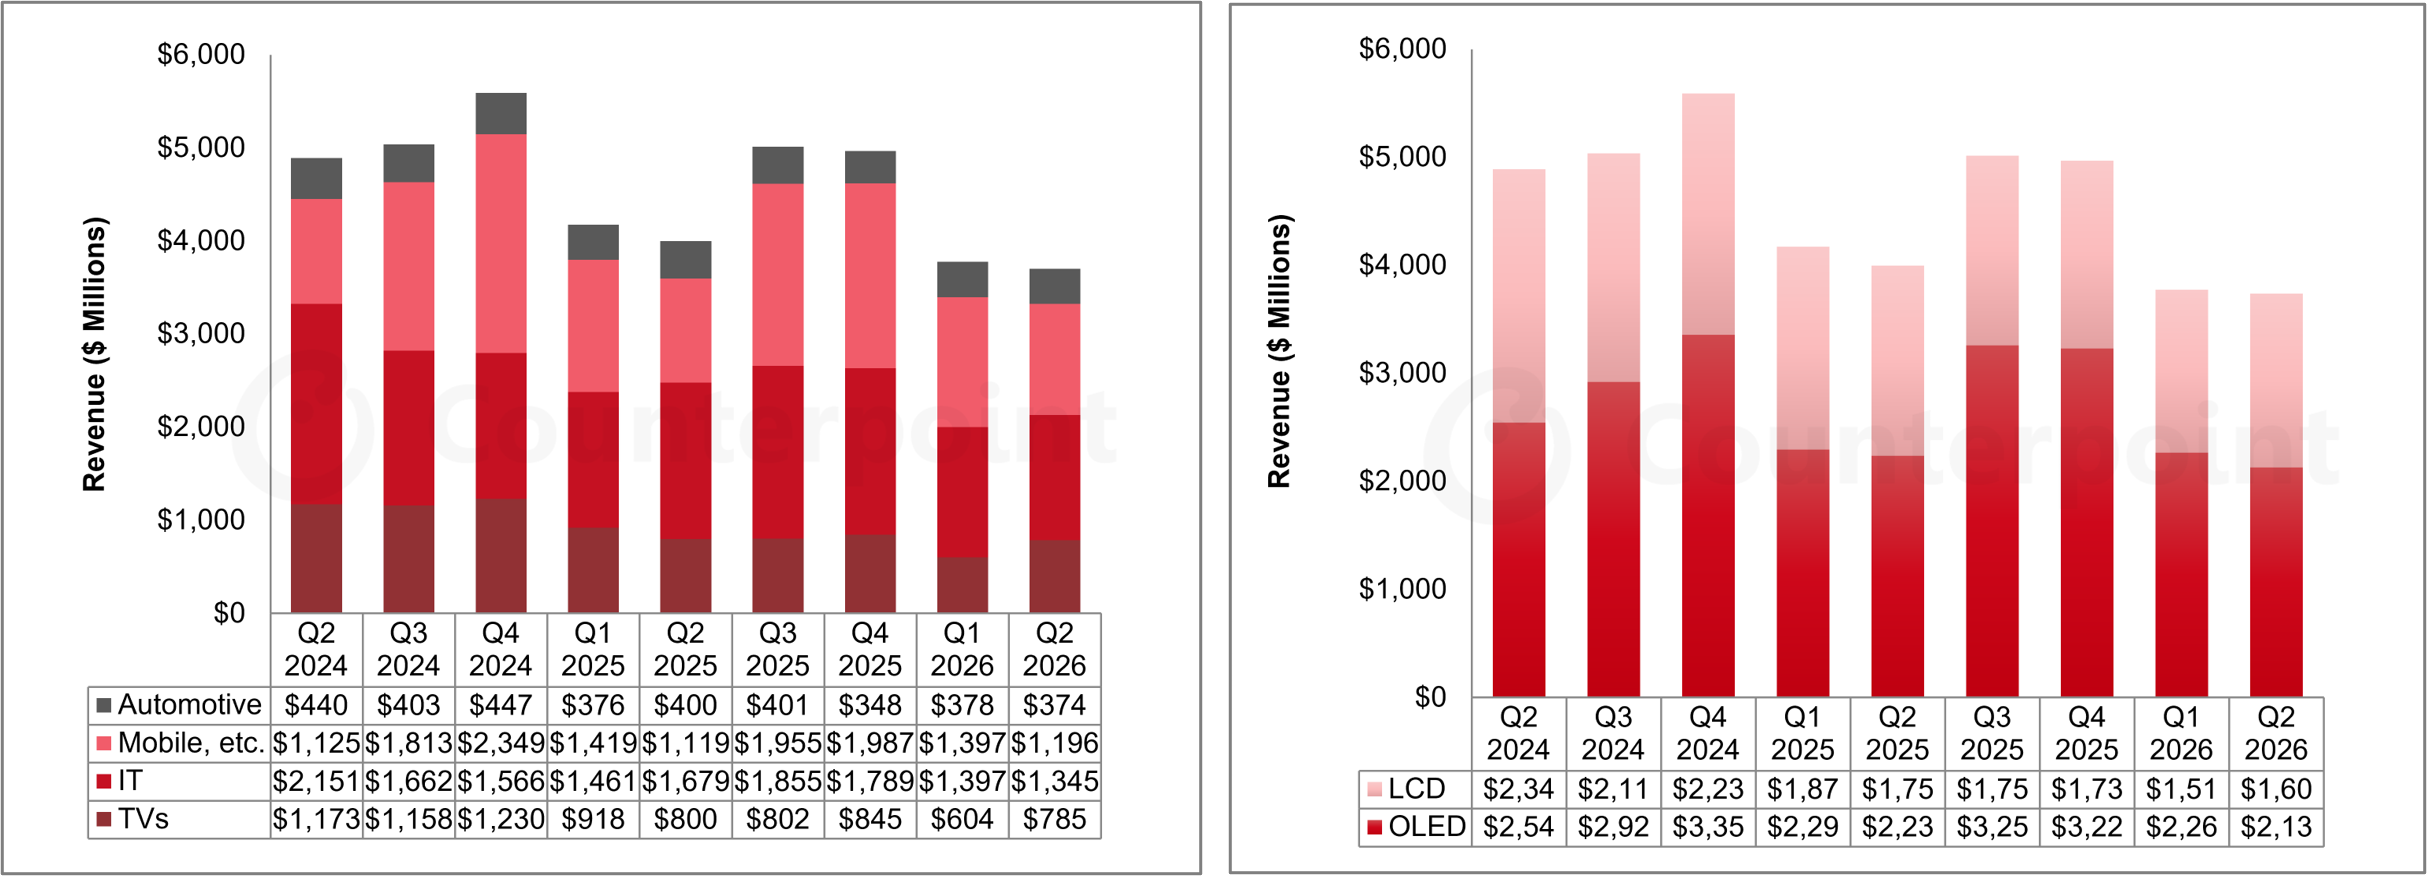
OLED panel revenues decreased 6% QoQ and 5% YoY in $ terms in Q2 2026. OLED represented 57% of LGD revenues in Q2 2026, down from 60% in Q1 2026 but up 1% YoY. LCD panel revenues increased 6% QoQ but decreased 9% YoY.
LGD area shipments increased 12% QoQ but decreased 11% YoY to 3.6 million square meters. Area price decreased 13% QoQ but increased 2% YoY to $1,079.
LG Display Revenues by Application (L) and Display Technology (R)
LGD inventory value increased by 11% QoQ in KRW terms, and inventory days increased from 53 to 58. LGD's cash and cash equivalents were down 7% QoQ and 19% YoY in $ terms.
LGD debt decreased 5% QoQ in $ terms and equity decreased 4% QoQ in $ terms. Its debt/equity decreased sequentially from 177% to 175% and net debt/equity decreased from 157% to 156%.
As of July 23, 2026, LGD's market value of equity was KRW 5.24 trillion, for a price-to-book ratio of 0.68 (decreased from 0.99 in April). LGD's debt-to-market equity was 256% and its net debt-to-market equity was 228%.
LGD reported positive cash flow from operations of KRW 1,157 billion ($770 million) and positive free cash flow of KRW 515 billion ($343 million). LGD reported capital expenditures of KRW 642 billion ($427 million).
In its outlook for Q3 2026, LGD expects area shipments to increase by a mid-single-digit % QoQ, despite some pull-in effect in Q2 in TV. LGD expects area prices to increase by a high-teen % with a mix shift toward higher-priced mobile panels. LGD increased its full-year capex guidance from KRW 2 trillion to mid-to-high KRW 2 trillion (i.e. KRW 2.5-2.9 trillion).
LGD made no change in its outlook for large panels in 2026. The company had previously guided that it expects to reach just over seven million units, with about 10% YoY growth, and that monitors will grow as a percentage of large-screen shipments from the low teens in 2025 to around 20% in 2026.
Separately from the earnings call, the South Korean government's National Growth Fund announced on July 23 that LGD would receive KRW 1.3 trillion for development of OLED technology. LGD plans to borrow KRW 1.3 trillion from the National Growth Fund and add KRW 1.5 in equity and KRW 200 billion in private loans to invest KRW 3 trillion in small-to-mid-size OLED technologies.
Category
Industry
Display
Service
Display Market Trends
Report Type
Report
Time Period
Weekly
Receive our insightful weekly newsletter and stay ahead of the competition.
Author
Bob Obrien
Robert J (Bob) O’Brien joined Counterpoint Research as part of its acquisition of DSCC, where he was Co-Founder, Principal and CFO of DSCC. Bob has decades of experience turning market and business analysis into strategic insights in the display and electronics industries. At DSCC, Bob takes the lead role in analysis of display materials, including glass and AMOLED materials, and covers developments in TV and other large-screen display applications. He is the principal author of DSCC’s AMOLED Material Report, the Advanced TV Shipment Report, and the Display Glass Report, and Bob contributes regularly to the DSCC Weekly Review.