AUO Reports Net Profit for Q4 2025 and Full Year Despite Operating Loss
AUO managed to report a net profit in the fourth quarter of 2025 and for the full year, despite another quarter of operating losses. The company relies on extraordinary gains to bring itself into the black.
The company reported net income of TWD 2.9 billion ($94 million) on revenue of TWD 70.1 billion ($2.3 billion). Operating income was a loss of TWD 1.4 billion ($61 million). Revenues beat consensus expectations by 2%, but the operating income was worse than consensus expectations of a loss of TWD 1.4 billion.
Net income was much better than consensus expectations of a loss of TWD 1.0 billion. Q4 2025 revenues were flat QoQ and up 2% YoY. AUO reported net non-operating income of TWD 4.8 billion.
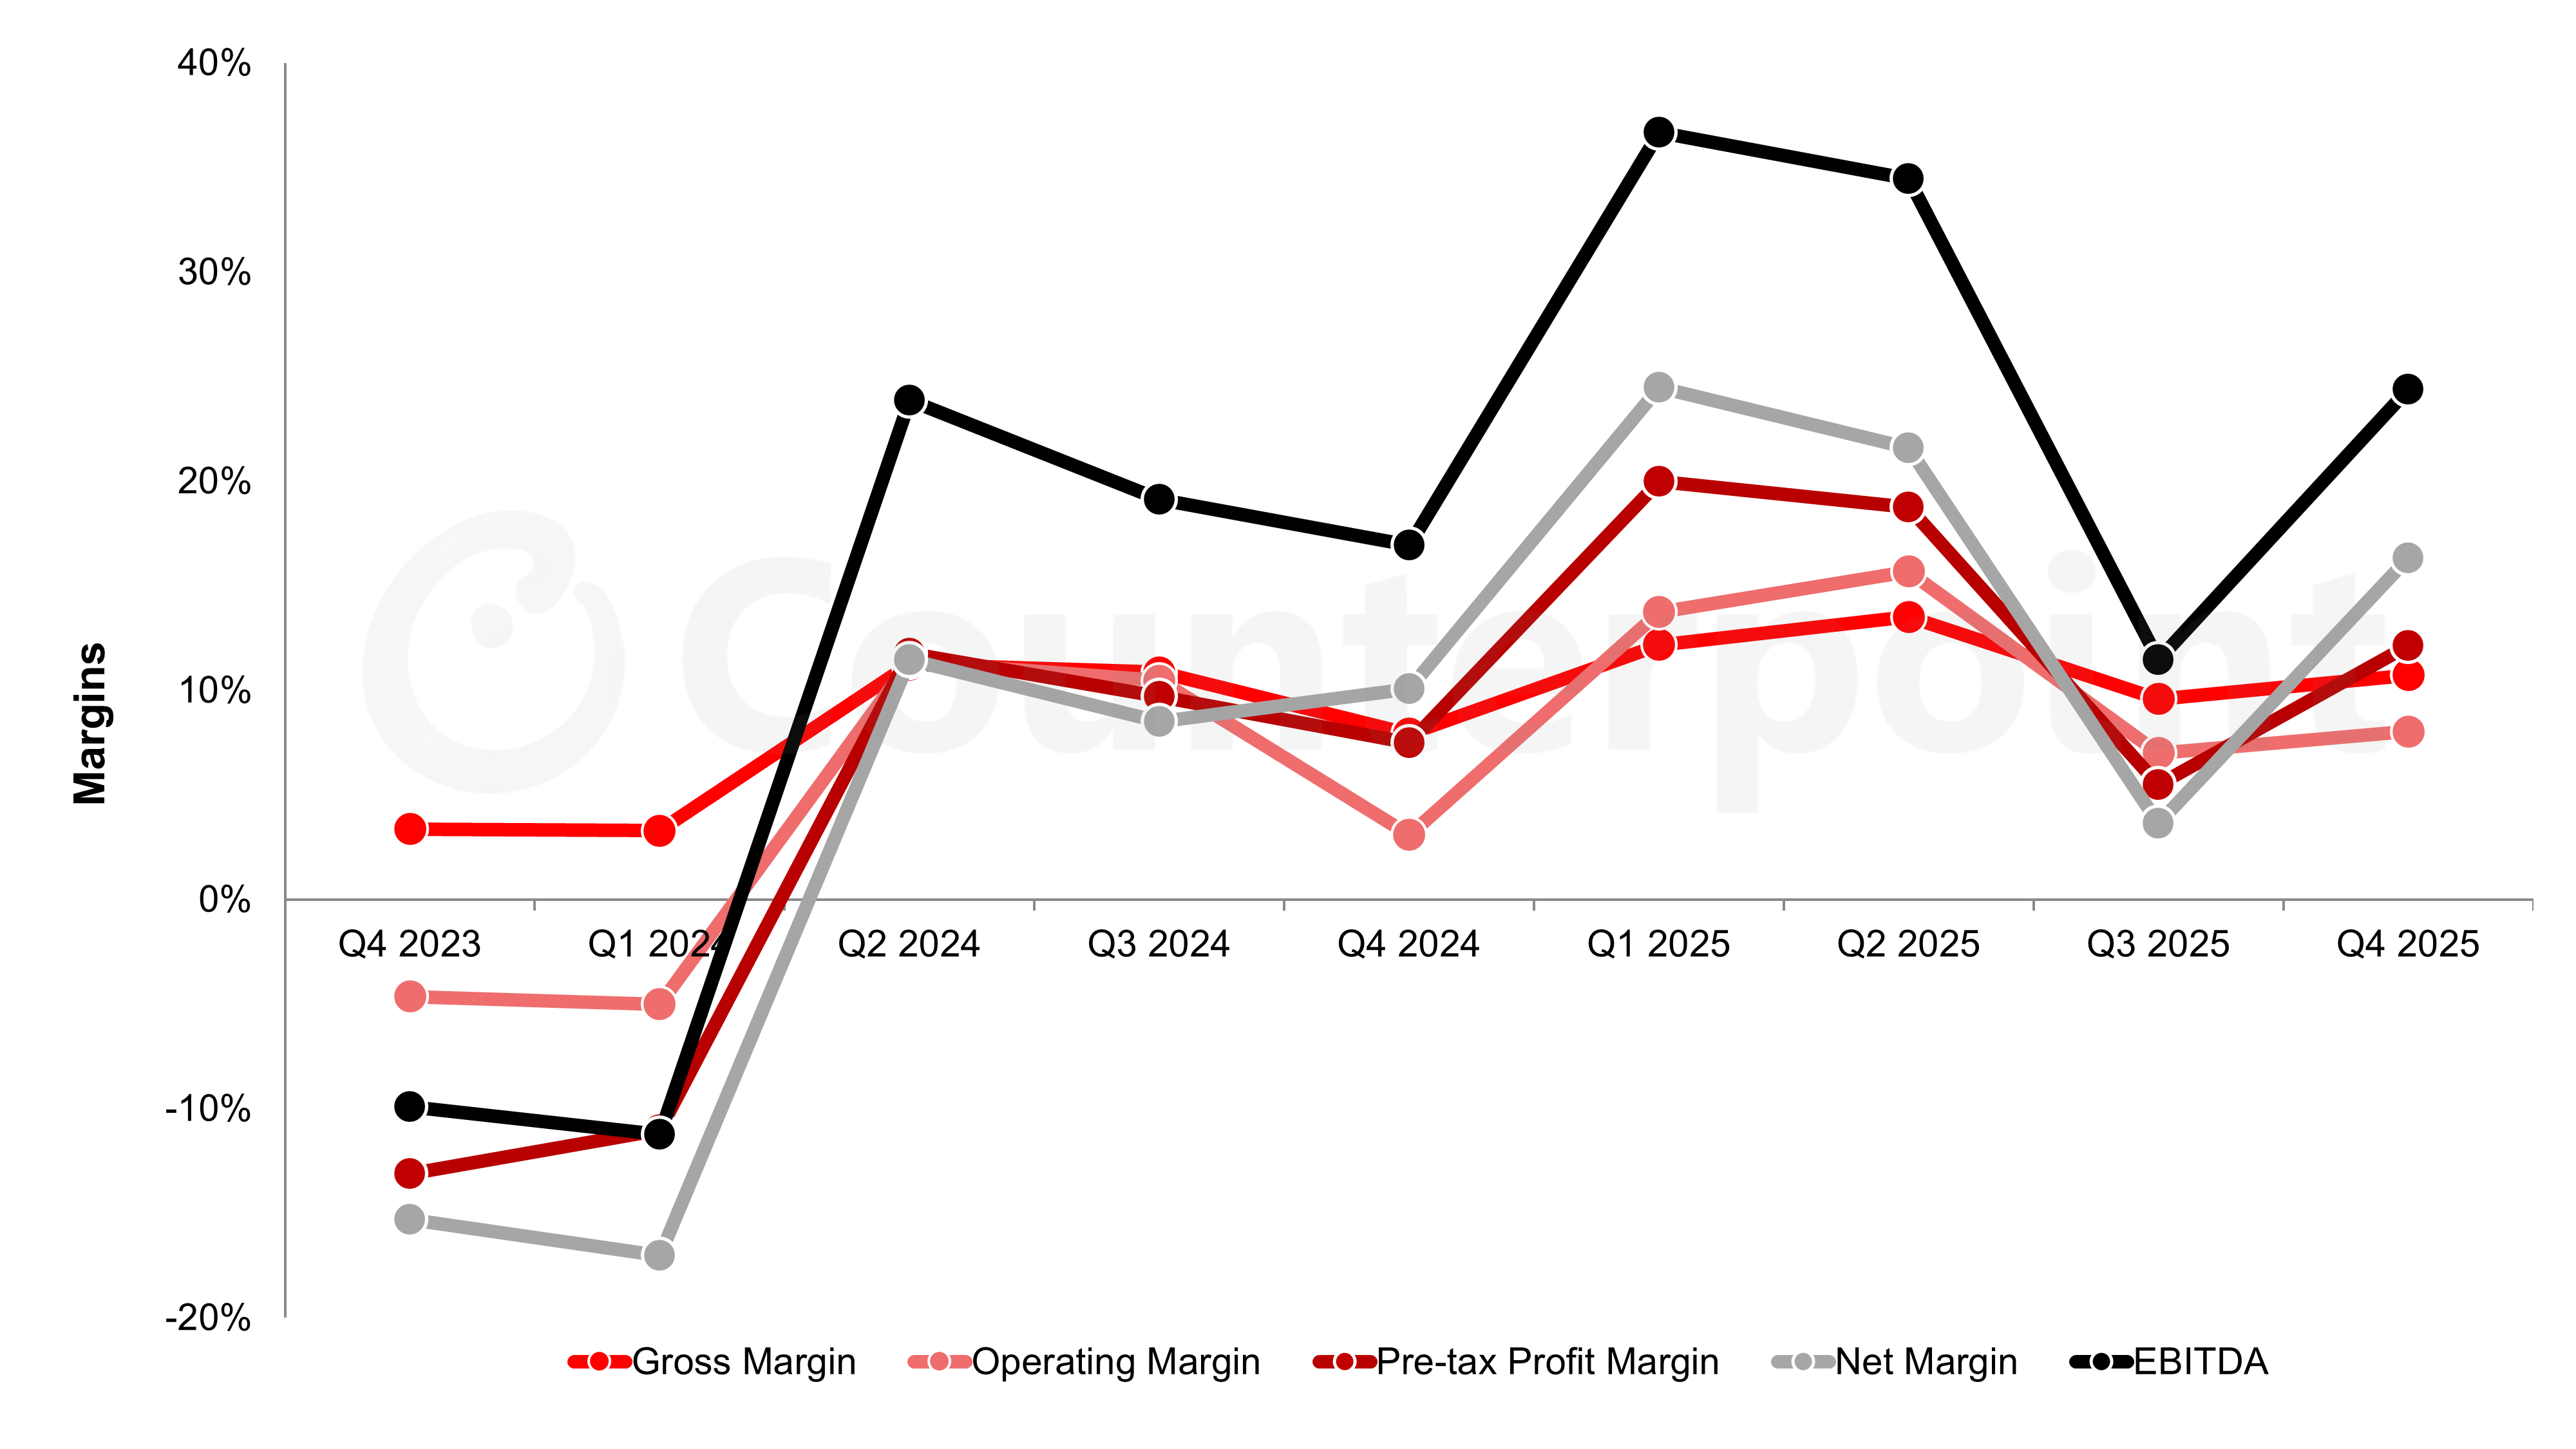
Q4 2025 gross margin improved by 1% and EBITDA and operating margins were flat QoQ, but net margin improved by 6%. The New Taiwan dollar (TWD) weakened by 4% QoQ but strengthened by 4% YoY.
AUO Quarterly Income Statement Highlights
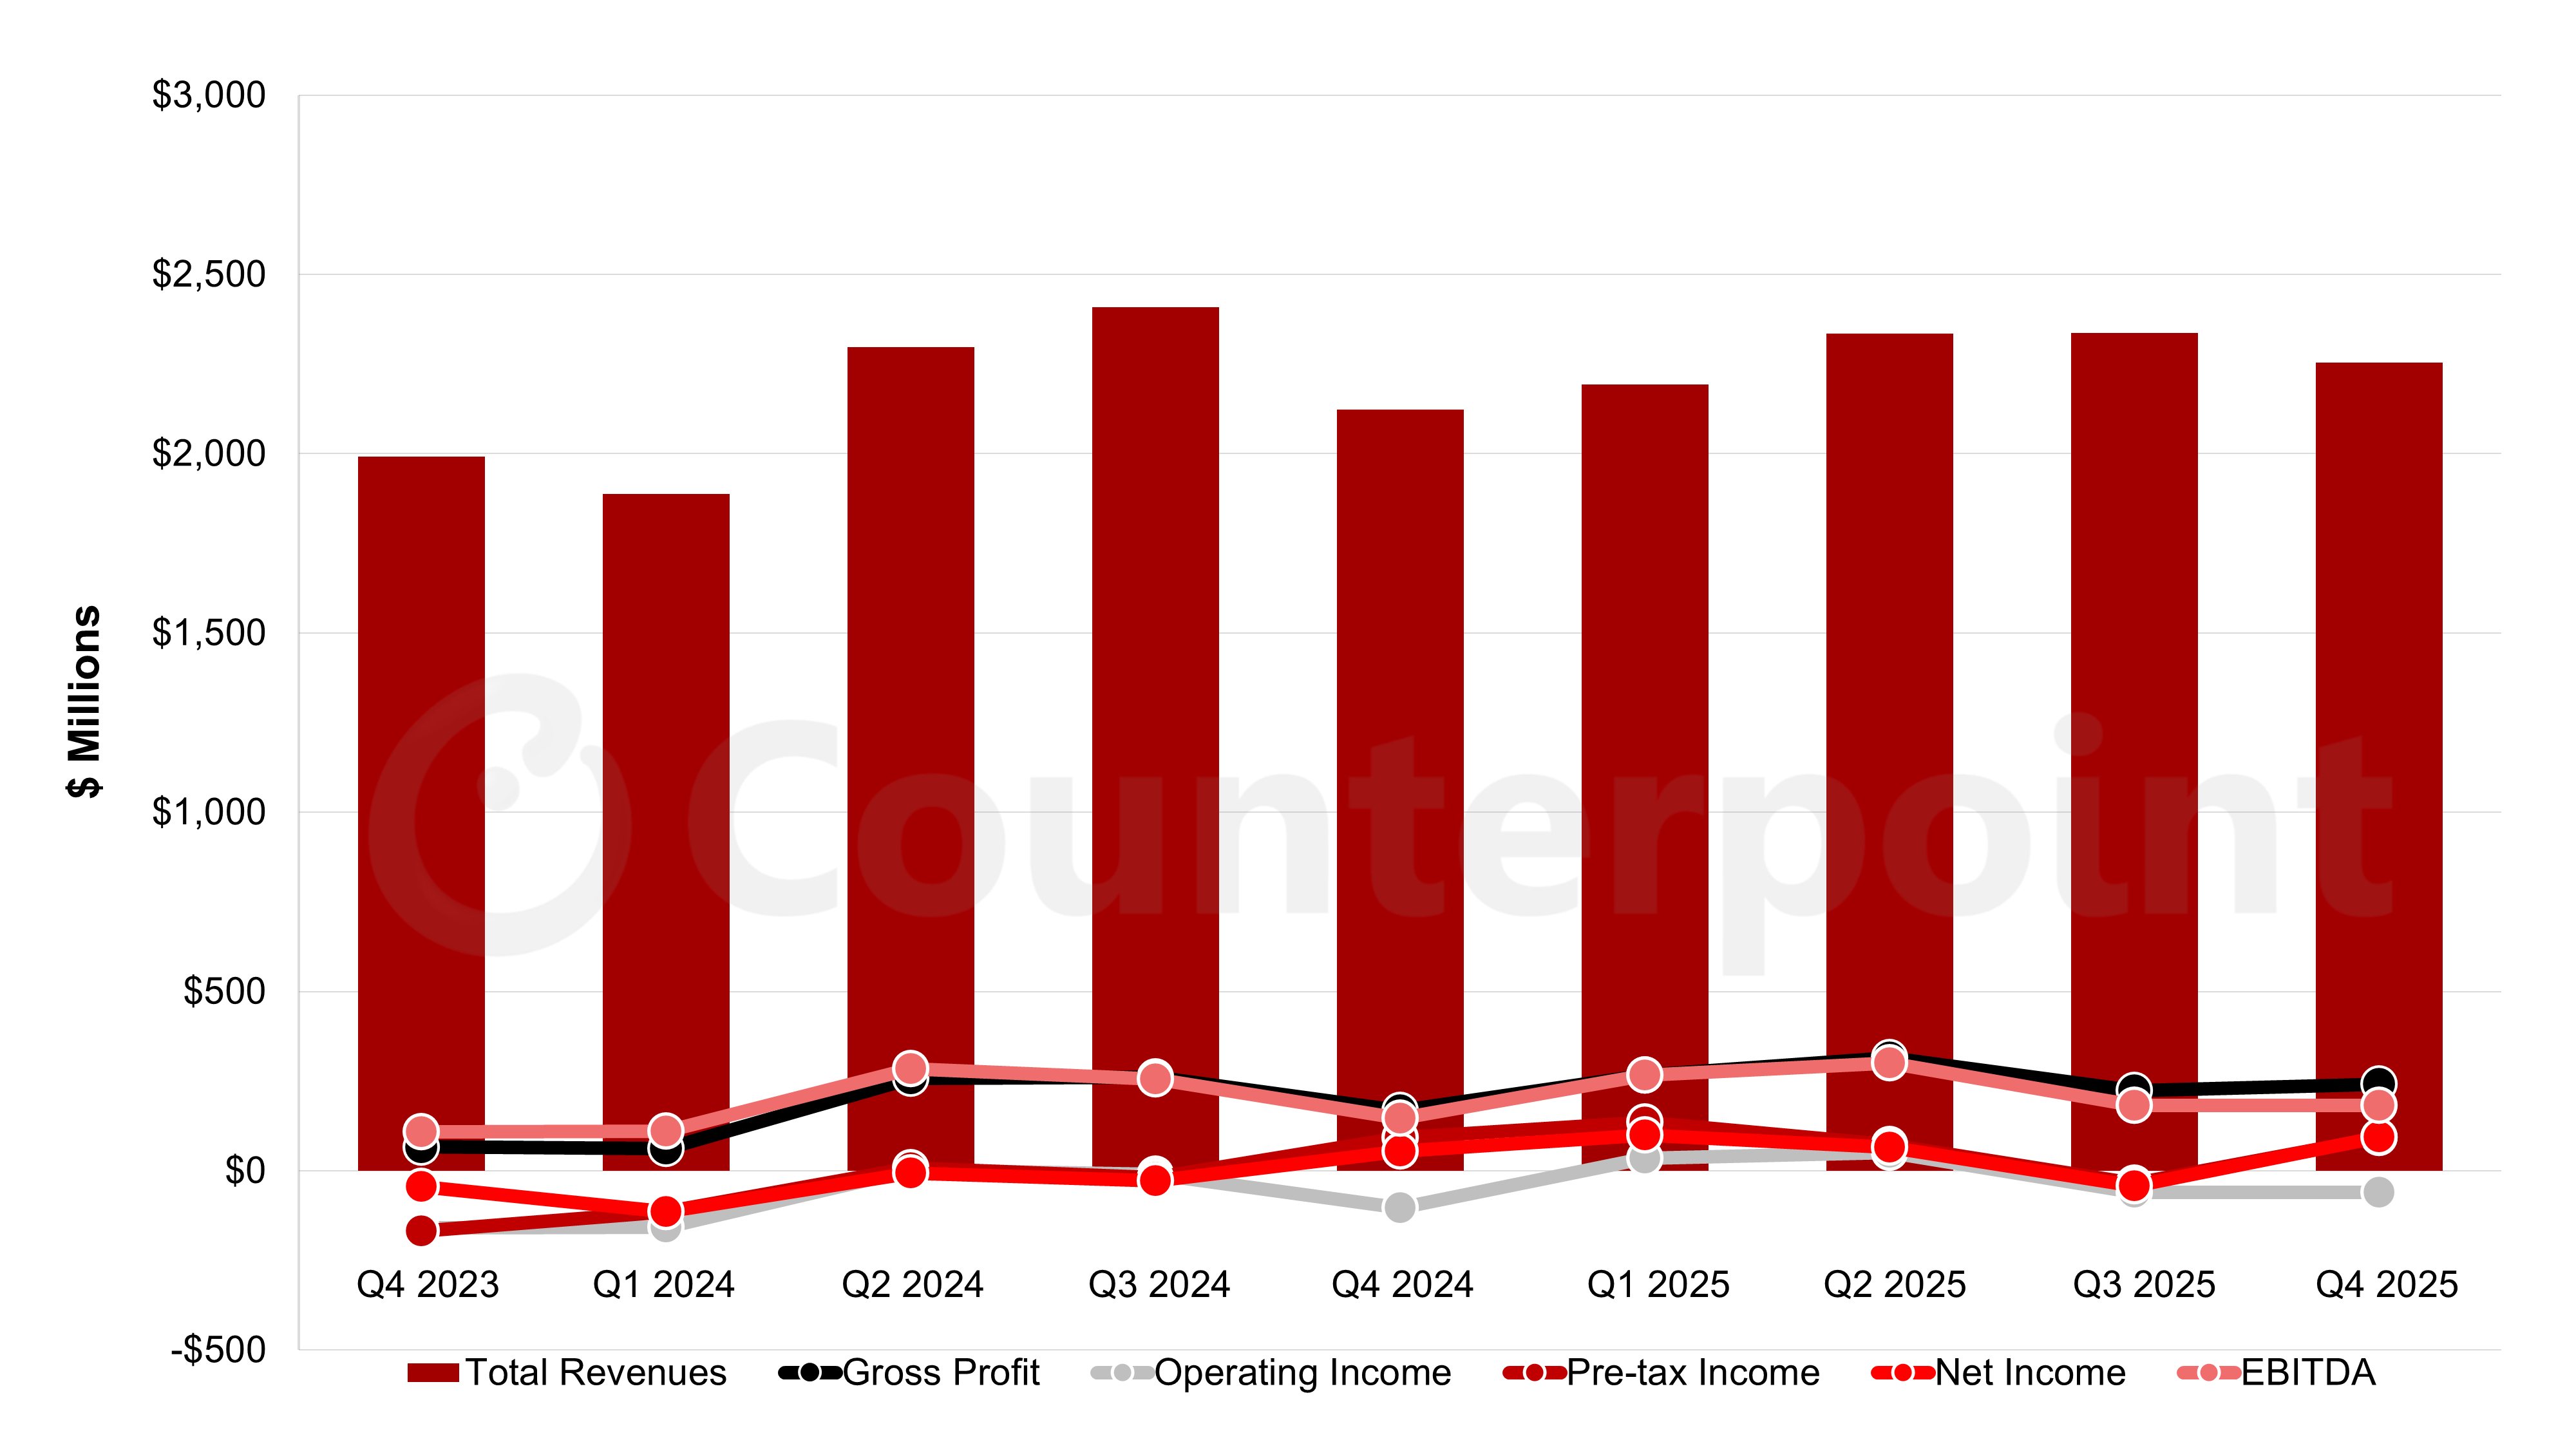
AUO Quarterly Income Statement Highlights
For the full year, AUO reported net income of TWD 6.9 billion ($216 million) on revenues of TWD 281.4 billion ($9.1 billion). This was the first year of net profits since 2021.
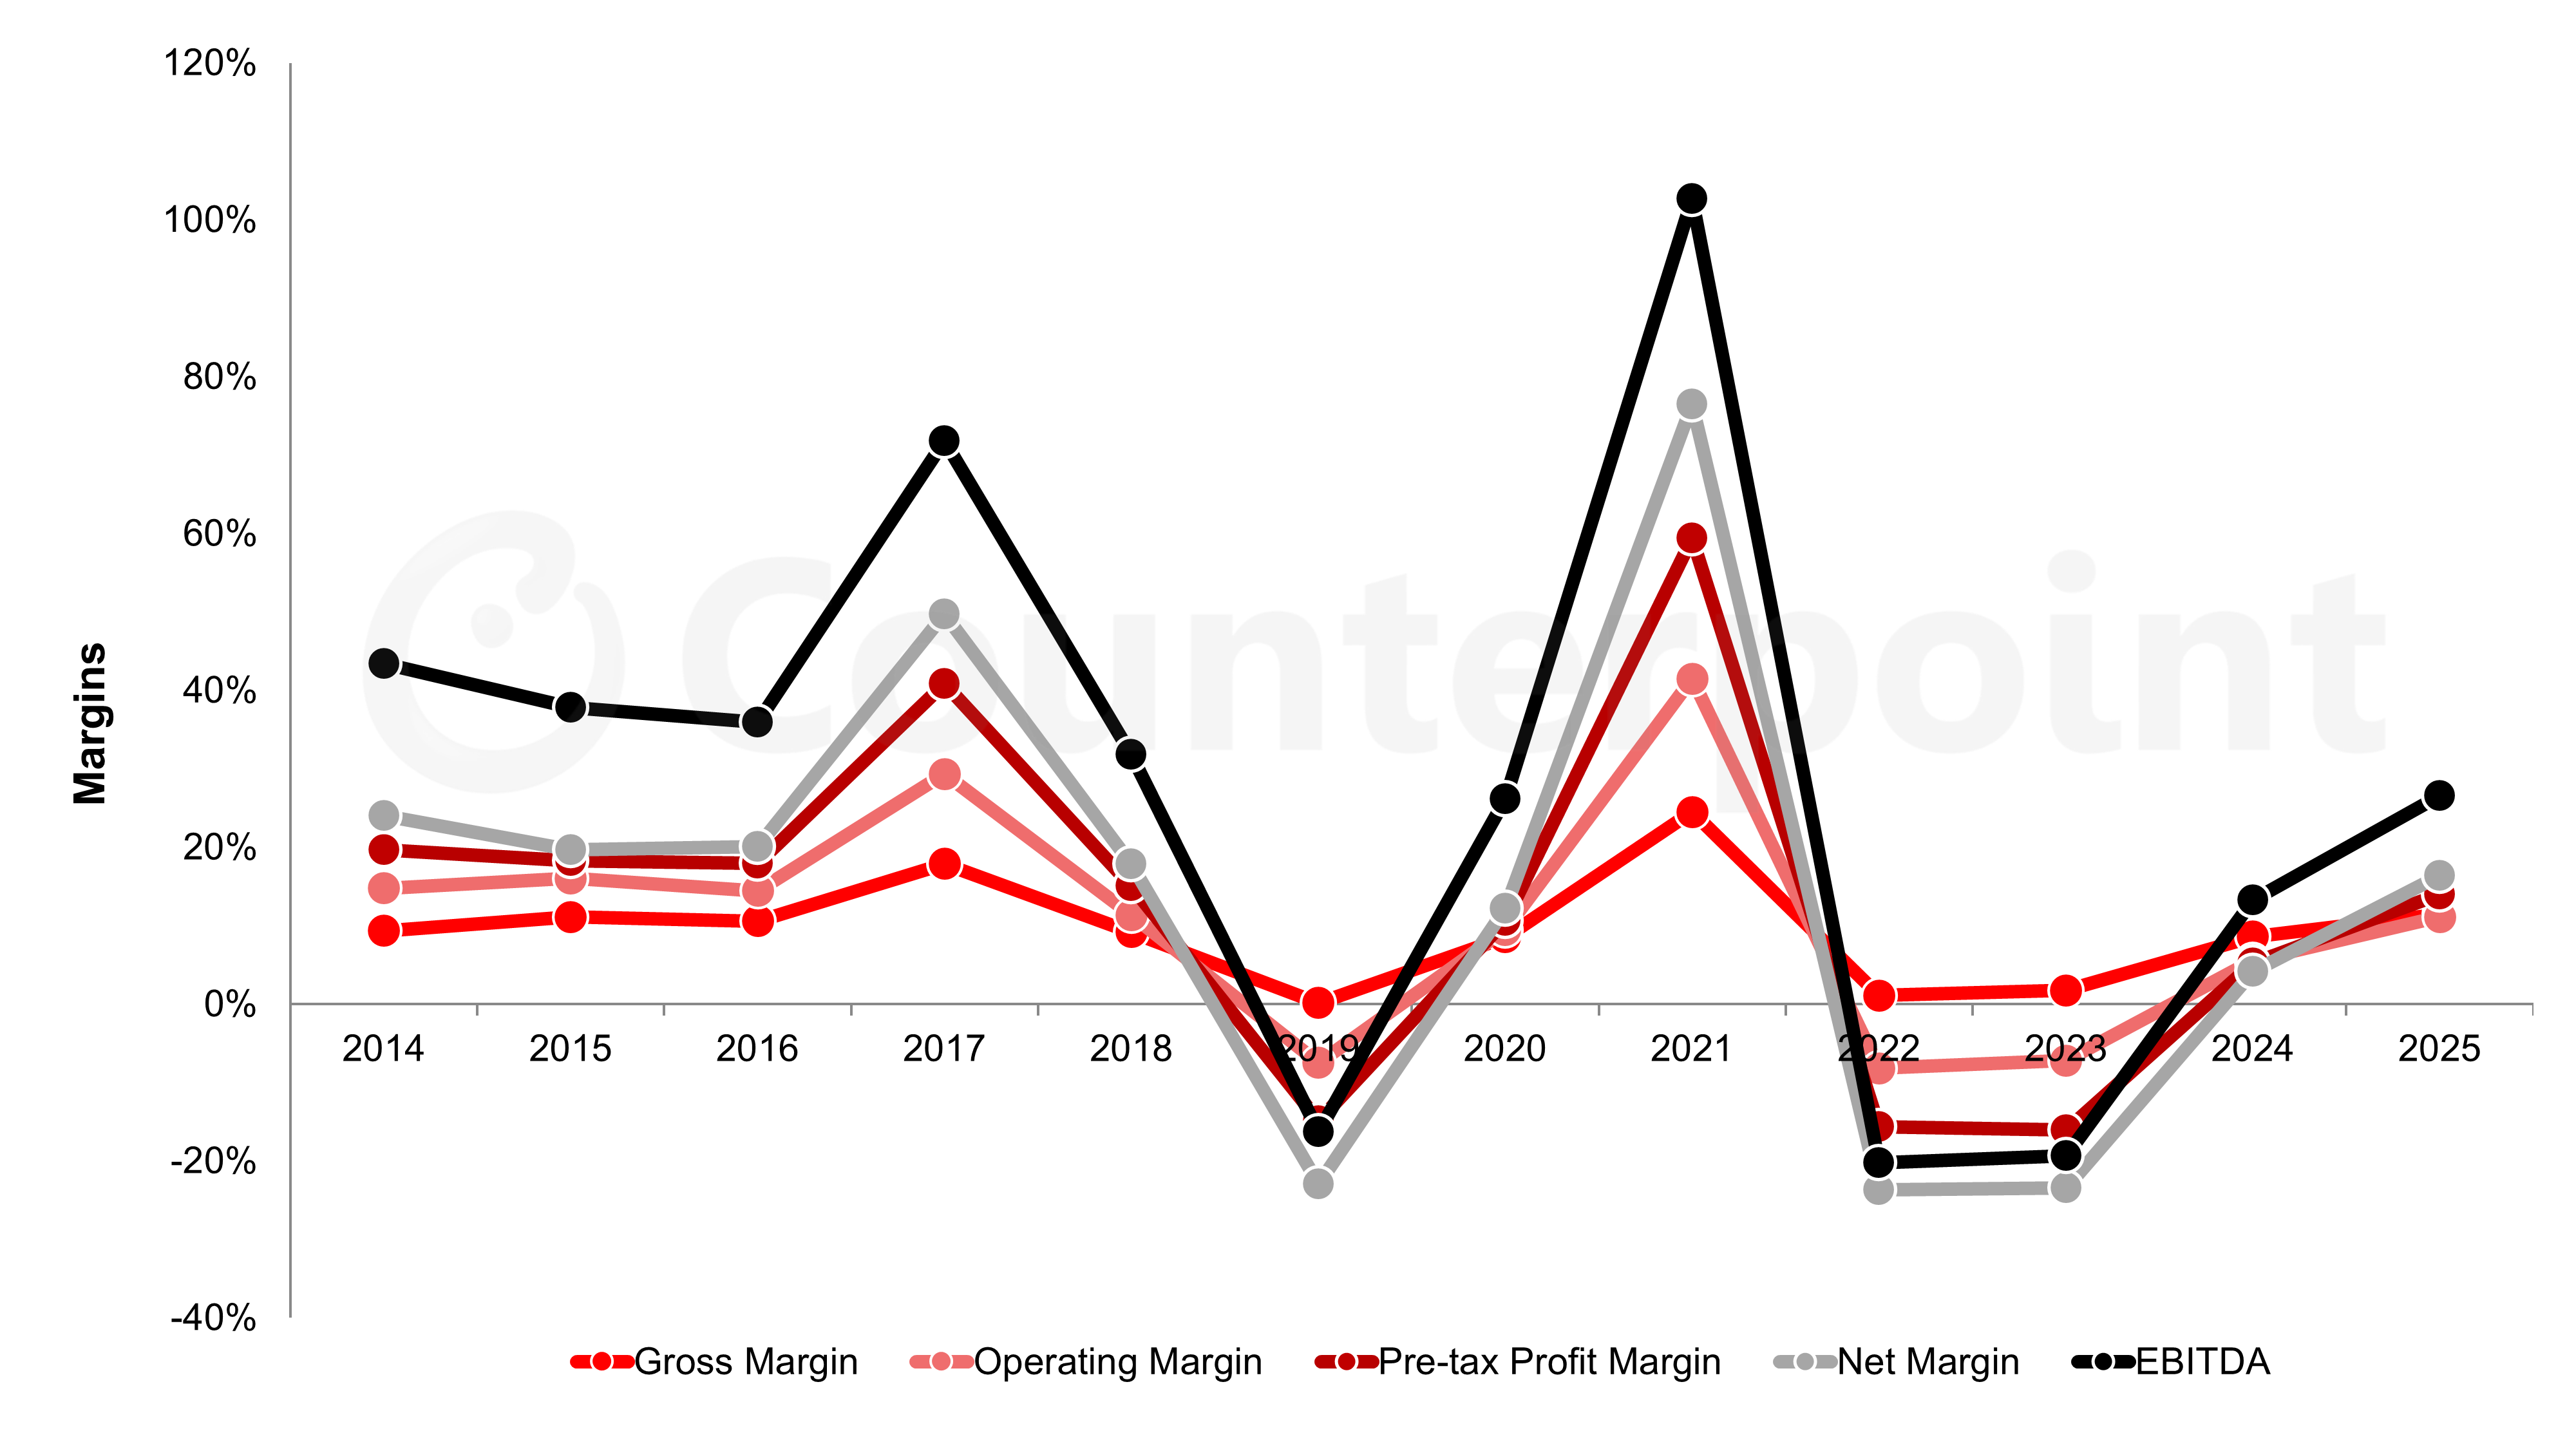
AUO reported a full-year operating loss of TWD 1.1 billion ($36 million), its fourth consecutive year of operating losses. Full-year margins improved by between 1% and 3%.
AUO Annual Income Statement Highlights
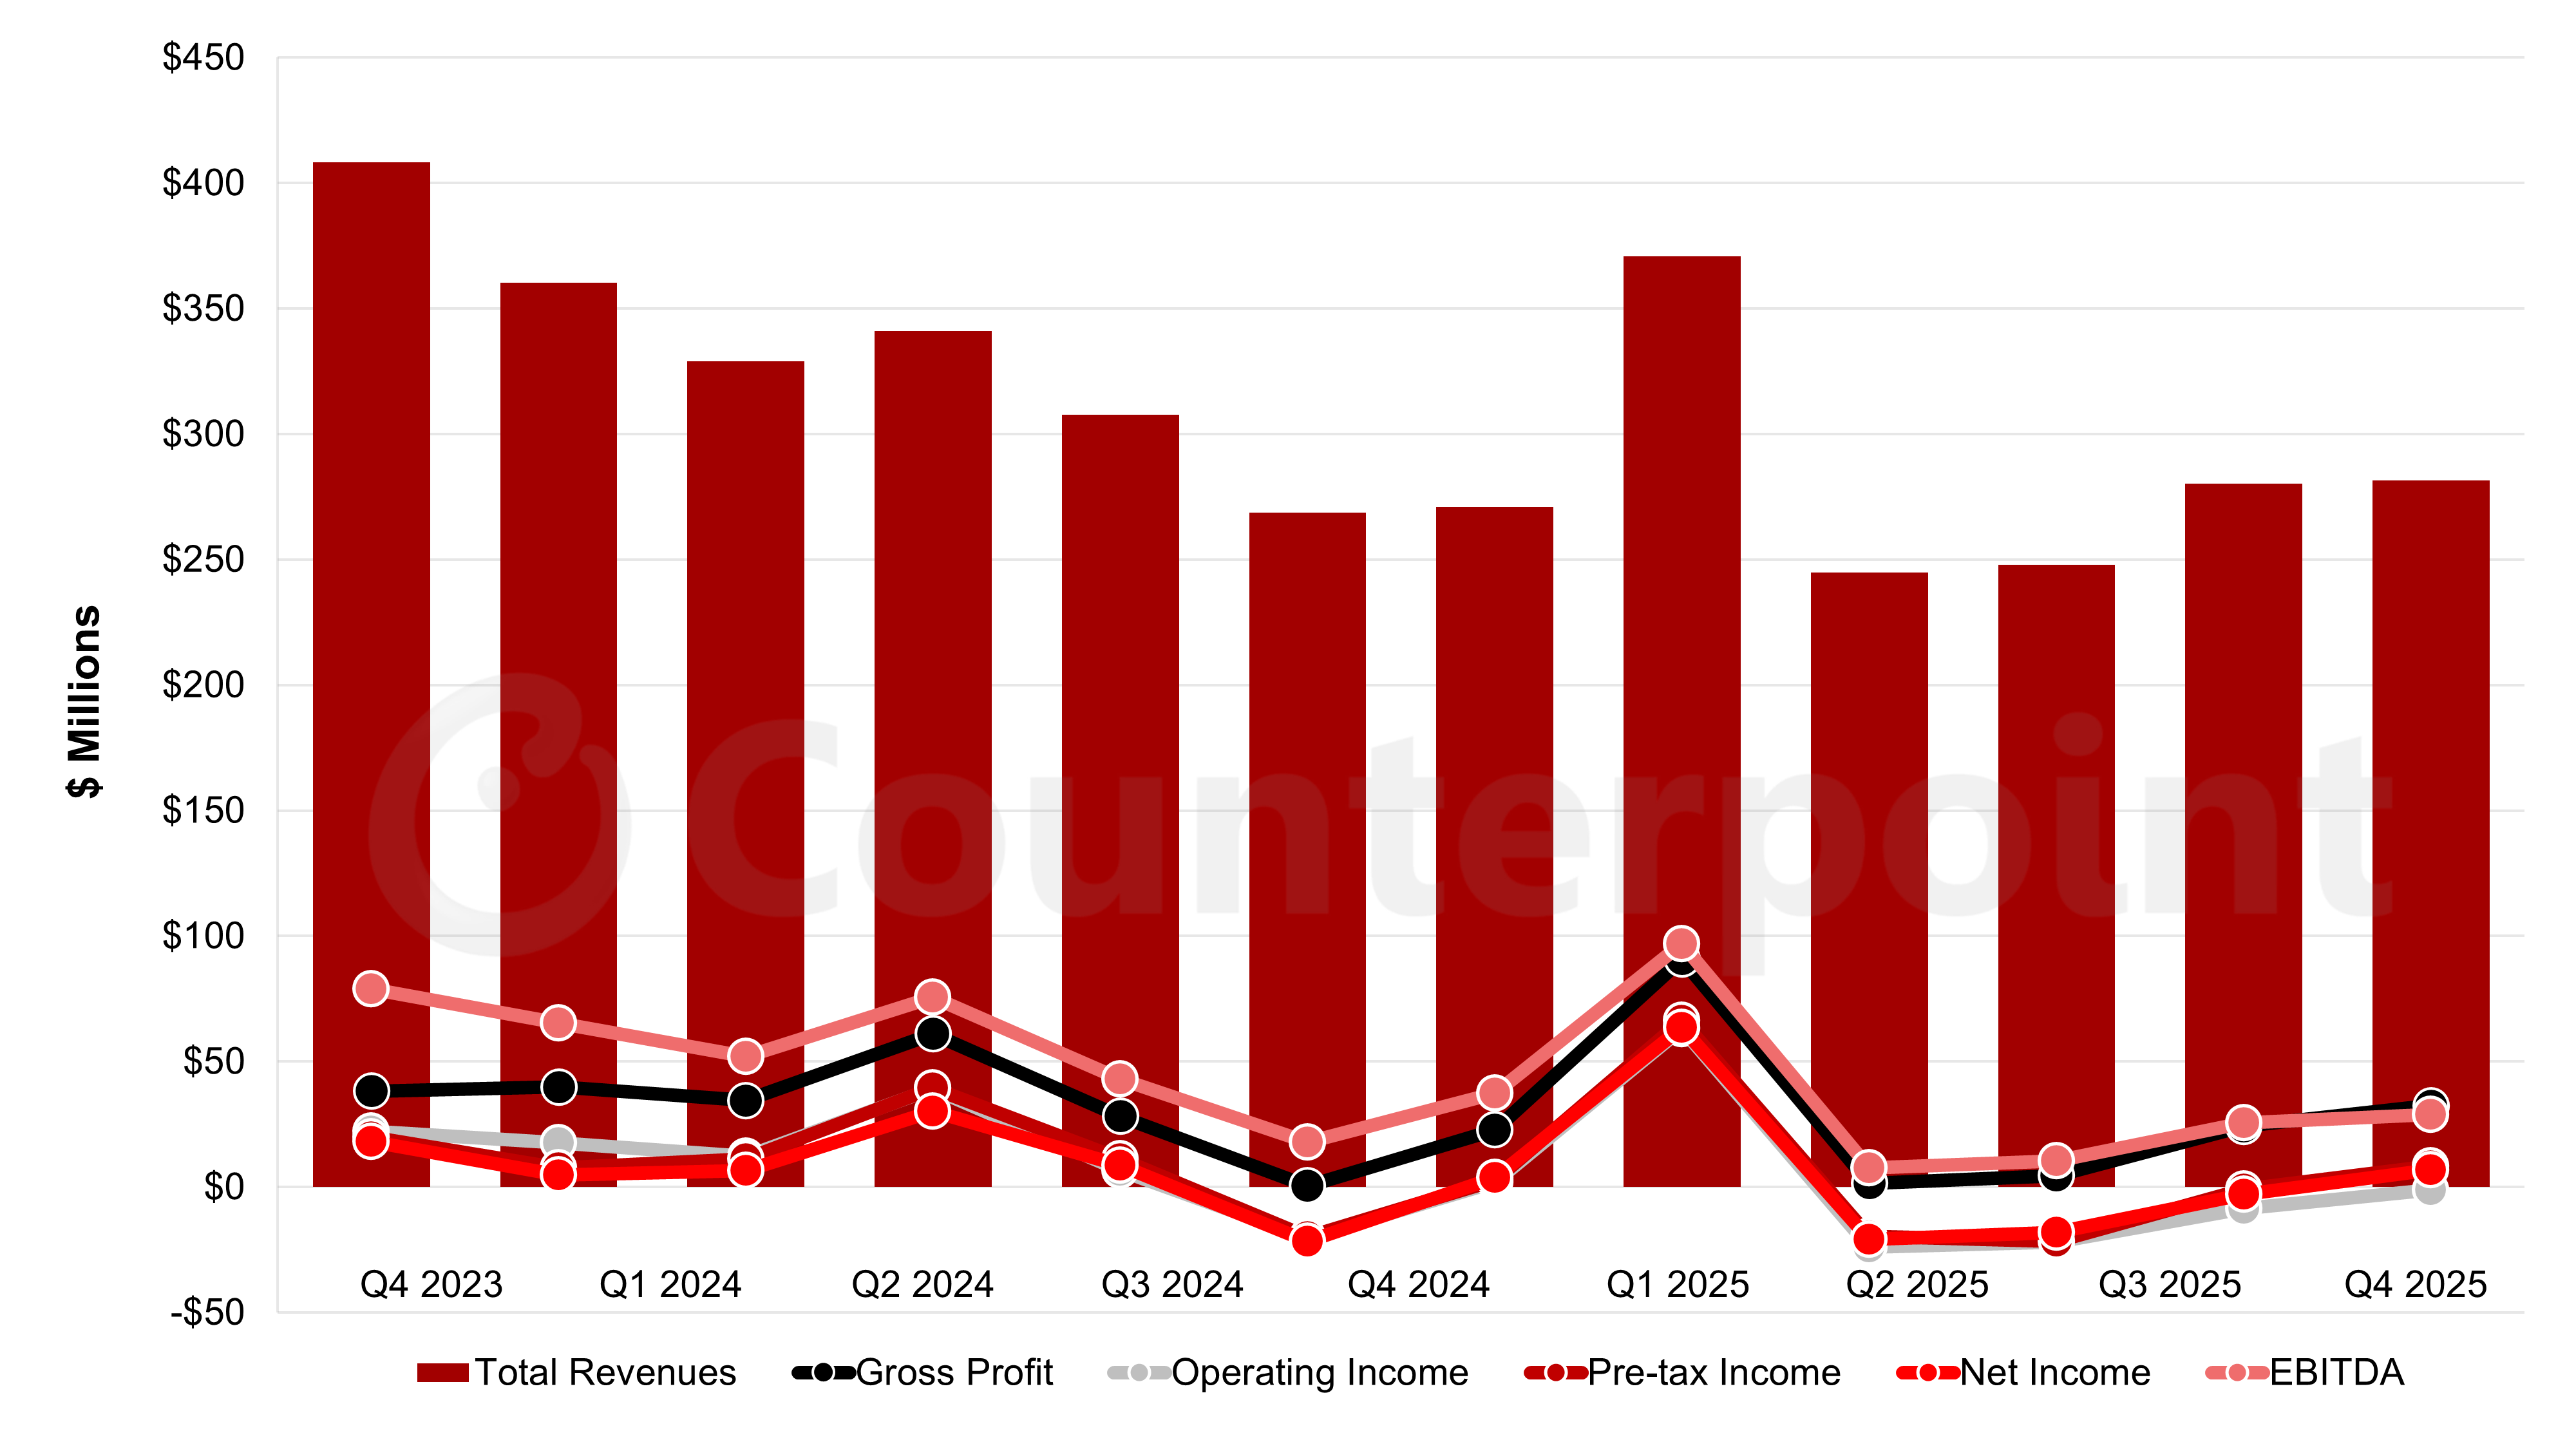
AUO Annual Income Statement Highlights
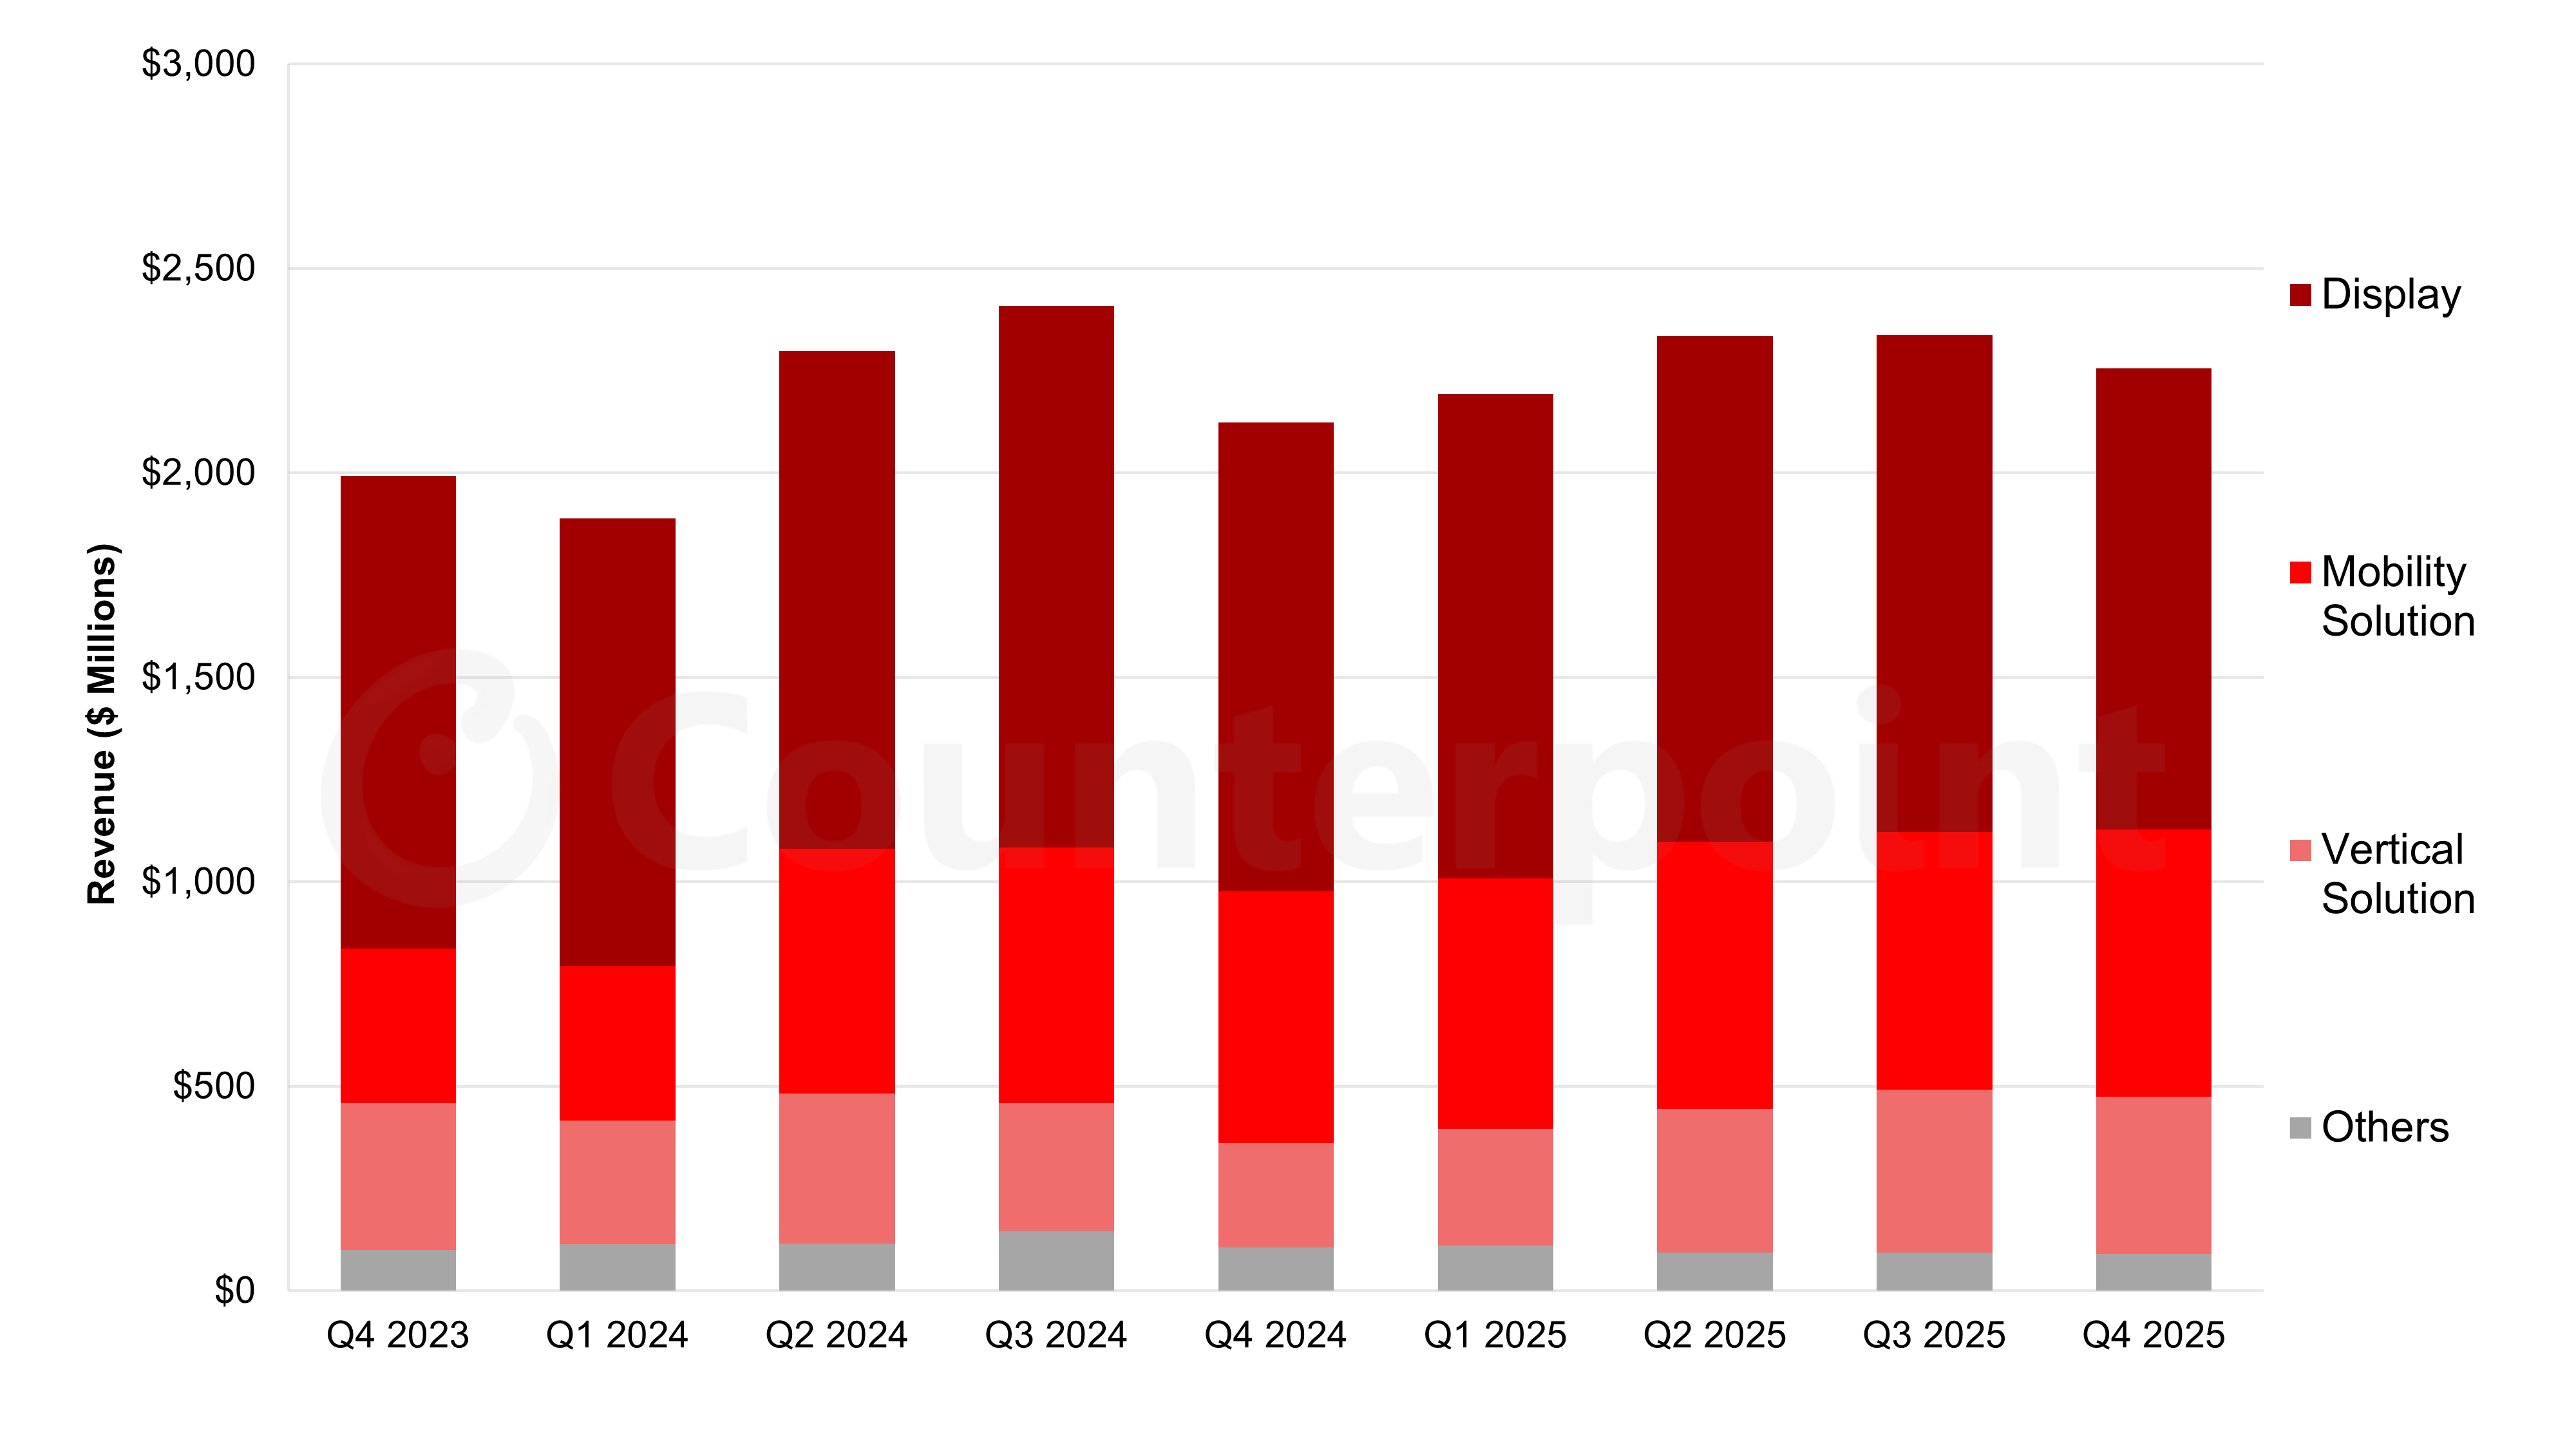
Starting in Q3 2024, AUO reclassified its revenues into new business segments – Mobility Solution, Vertical Solution, Display and Others.
- Mobility Solution consists of AUO's automotive display business, its recently-acquired Tier 1 auto supplier BHTC and Display HMI (human machine interface). Mobility solution revenues were up 8% QoQ and 2% YoY to TWD 20.3 billion ($654 million), 29% of total revenues.
- Vertical Solution consists of AUO's PID and General Display segment, plus Energy and Smart vertical businesses. Vertical solution revenues were flat QoQ but up 45% YoY to TWD 11.9 billion ($383 million), 17% of total revenues.
- Display includes AUO's TV, Monitor and Mobile PC and Device groups, plus LED and Systems DMS. Display revenues decreased 4% QoQ and 5% YoY to TWD 35.1 billion ($1.13 billion), 50% of total revenues.
- The remaining 5% of revenues primarily included Darwin. Other revenues were flat QoQ but decreased 18% YoY to TWD 2.8 billion ($90 million), 4% of total revenues.
AUO Quarterly Revenue by Business Segment
AUO inventory was up 1% QoQ and inventory days increased from 52 to 53. AUO debt decreased 15% in the quarter in TWD terms to TWD 100 billion, and decreased 18% QoQ in $ terms to $3.2 billion. Equity increased 4% QoQ in TWD terms to $163.8 billion.
Debt/equity decreased from 75% to 61% and net debt/equity decreased QoQ from 39% to 27%. As of February 10, 2026, AUO had a market capitalization of TWD 112.4 billion, for a price-to-book ratio of 0.69 (up from 0.61 QoQ). AUO's debt-to-market equity is 89% and its net debt-to-market equity is 57%.
AUO had capital expenditures of TWD 3.9 billion ($121 million), flat QoQ and down 46% YoY, and much less than depreciation of TWD 7.6 billion. AUO recorded a positive cash flow of TWD 2.9 billion ($94 million) from operations but a negative free cash flow of TWD 0.8 billion ($27 million).
AUO issued the following guidance for Q1 2026:
- Mobility solution: Up high single-digit % QoQ
- Vertical solution: Flat to down slightly QoQ
- Display: Moderate decline QoQ due to seasonality
AUO’s guidance implies Q1 revenues down in the low single digits % QoQ, or roughly TWD 68 billion.
Final comments
The longer-term annual results charts show a continuing decay in revenues over the last decade. AUO managed to report net profits only when it sold off fully depreciated assets. The company has not yet found a path to consistent profitability in its operations.
Category
Industry
Display
Service
Display Market Trends
Report Type
Report
Time Period
Weekly
Receive our insightful weekly newsletter and stay ahead of the competition.
Author
Bob Obrien
Robert J (Bob) O’Brien joined Counterpoint Research as part of its acquisition of DSCC, where he was Co-Founder, Principal and CFO of DSCC. Bob has decades of experience turning market and business analysis into strategic insights in the display and electronics industries. At DSCC, Bob takes the lead role in analysis of display materials, including glass and AMOLED materials, and covers developments in TV and other large-screen display applications. He is the principal author of DSCC’s AMOLED Material Report, the Advanced TV Shipment Report, and the Display Glass Report, and Bob contributes regularly to the DSCC Weekly Review.