

We have updated Counterpoint Research’s Quarterly OLED Supply/Demand and Capital Spending Report for Q3 2026 with our latest capacity outlook for the industry and forecast for OLED panel demand. The biggest change in our outlook stems from the slowdown in demand due to large price increases in smartphone handsets, caused by the surge in demand for memory chips to fill Artificial Intelligence (AI) data centers. We now expect the memory shortage to extend past 2027 and expect recovery to come only slowly. As a result, our forecast for demand for OLED smartphones and IT products has been reduced for 2026-2030. Lower demand means a greater oversupply, which will continue to make the pricing environment for OLED panels challenging.
The report combines Counterpoint Research’s comprehensive view of OLED capacity with our equally thorough analysis of OLED demand and compares supply and demand for both smaller screens and large-gen sizes. Counterpoint’s OLED capacity outlook extends to 2030 and covers the capacity for 97 different phases of OLED capacity investments over 13 different panel makers. The report details the industry’s supply capacity by manufacturer, country, substrate type (flexible/rigid/hybrid), deposition type, backplane type, color type and form factor.
In both small and large screens, OLED capacity today is led by South Korean panel makers Samsung and LGD, respectively. Capacity additions in China, including not only Chinese panel makers but also LGD’s fab in Guangzhou, have increased the country’s capacity share from 5% in 2017 to 45% in 2025. While capacity will increase in both regions, we forecast that capacity in China will be close to that of South Korea in 2028 and will surpass South Korea in 2029 and 2030. We do not forecast any OLED expansions in any other regions.
LGD’s combination of Gen 8.5 WOLED capacity in South Korea and China, plus Gen 6 capacity for smaller sizes in South Korea, gives it the industry lead in OLED capacity. But SDC’s addition of Gen 8.7 RGB OLED for IT applications, plus incremental Gen 8.5 capacity for QD OLED, has brought SDC to a close second place and the difference between the two South Korean manufacturers will be less than 1% by 2030.
In large-screen applications, LGD will continue to lead throughout our forecast, but incremental capacity additions by Samsung along with China Star’s revival of JOLED’s Inkjet-printed fab has reduced LGD’s share of capacity from 99% in 2020 to 78% in 2026. We do not expect more capacity additions for large-screen applications, and only incremental capacity adjustments in existing fabs through 2030.
In flexible OLED panels (which include panels for foldable and rollable devices), Samsung’s leading share of capacity has declined from 40% in 2021 to 28% in 2026 as Chinese panel makers have aggressively added capacity, and BOE will surpass SDC to take the #1 spot by 2028 with a large increase in Gen 8.7 capacity. By 2030, BOE’s share of flexible OLED capacity will reach 28% while SDC’s share will fall to 26%.
Flexible OLED Input Area for Mobile Applications by Manufacturer
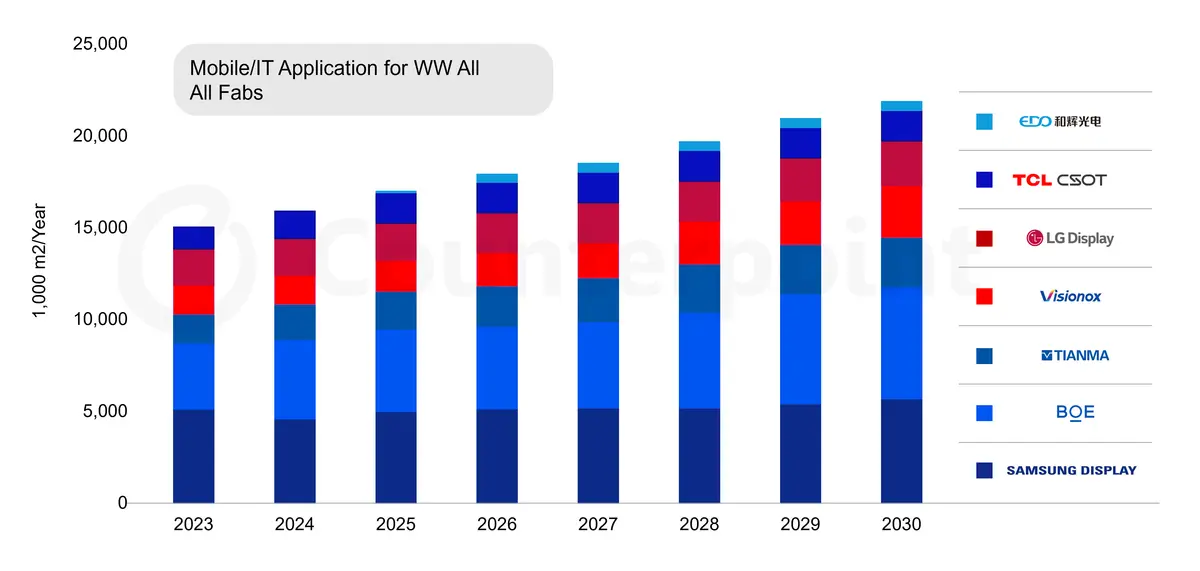
Source: Counterpoint Research OLED Supply/Demand and Capital Spending Report
While the input area is important, especially for materials suppliers, the supply/demand outlook is shaped by the product mix and yield. The report works through the details of fab ramps, yield curves and product mix to estimate the total industry output as shown in the figure below. Our report reflects the reality in the industry that yields on mobile OLED panels are lower for all panel makers compared to Samsung Display, and that yields on larger-size panels for IT applications will start at levels lower than smartphone yields. But our forecast sees continued yield improvements as panel makers progress through the experience curve.