LCD TV Panel Prices Will Wilt in the Heat of Summer 2026
LCD TV panel prices reached a temporary peak in April-May 2026 and will fall starting in June, continuing into Q3 2026.
The downturn comes despite a modest uptick in TV demand as the year started. Global TV shipments increased 3% YoY in Q1 2026, according to Counterpoint’s Global TV Shipments Monthly Tracker. The geographic pattern of shipments indicates that this is setting up inventory ahead of the World Cup, which will take place in the US, Canada and Mexico starting in June. Shipments increased in Latin America (+5%), North America (+10%) and Western Europe (+18%), while shipments were flat or down in China and other regions.
The coming downturn in panel prices indicates that the mini-surge in demand has run its course; TV brands have set up their product lines and have prepared enough inventory on hand. Now there are few demand drivers until the second half of the year.
The first chart here highlights our latest TV panel price update with a forecast through August 2026. Since the beginning of 2024, we have been through two cycles of rally and slump, and the third rally and slump is happening in the first half of 2026.
Prices in May came in exactly according to our expectations; we expected prices across all sizes to be stable compared to April, and that is what we saw. For June 2026, we expect prices for all screen sizes to be down by $1-$3.
LCD TV Panel Prices, Jan 2024 – Aug 2026
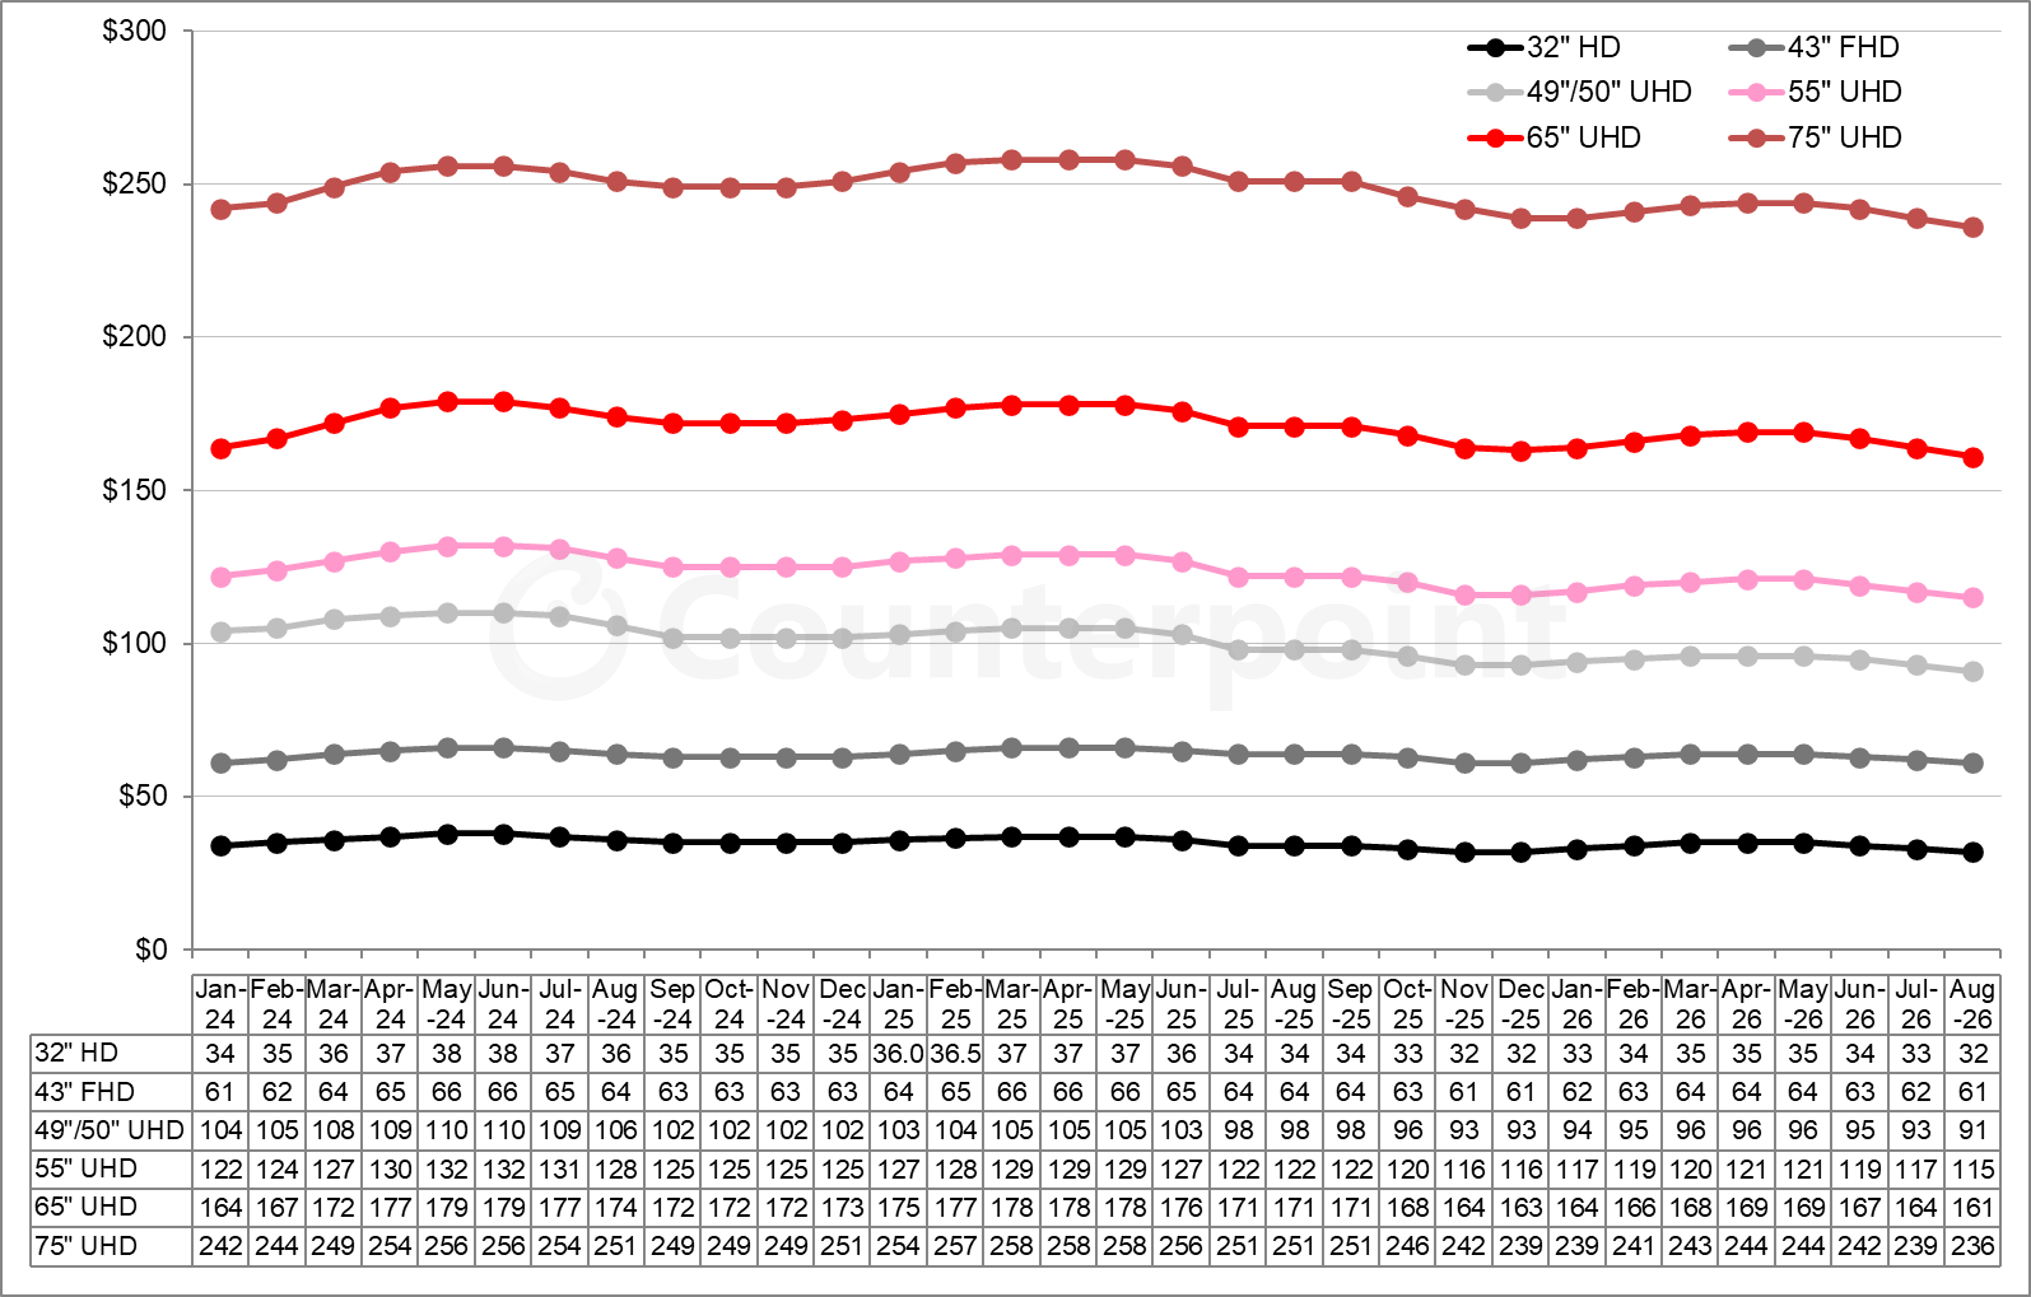
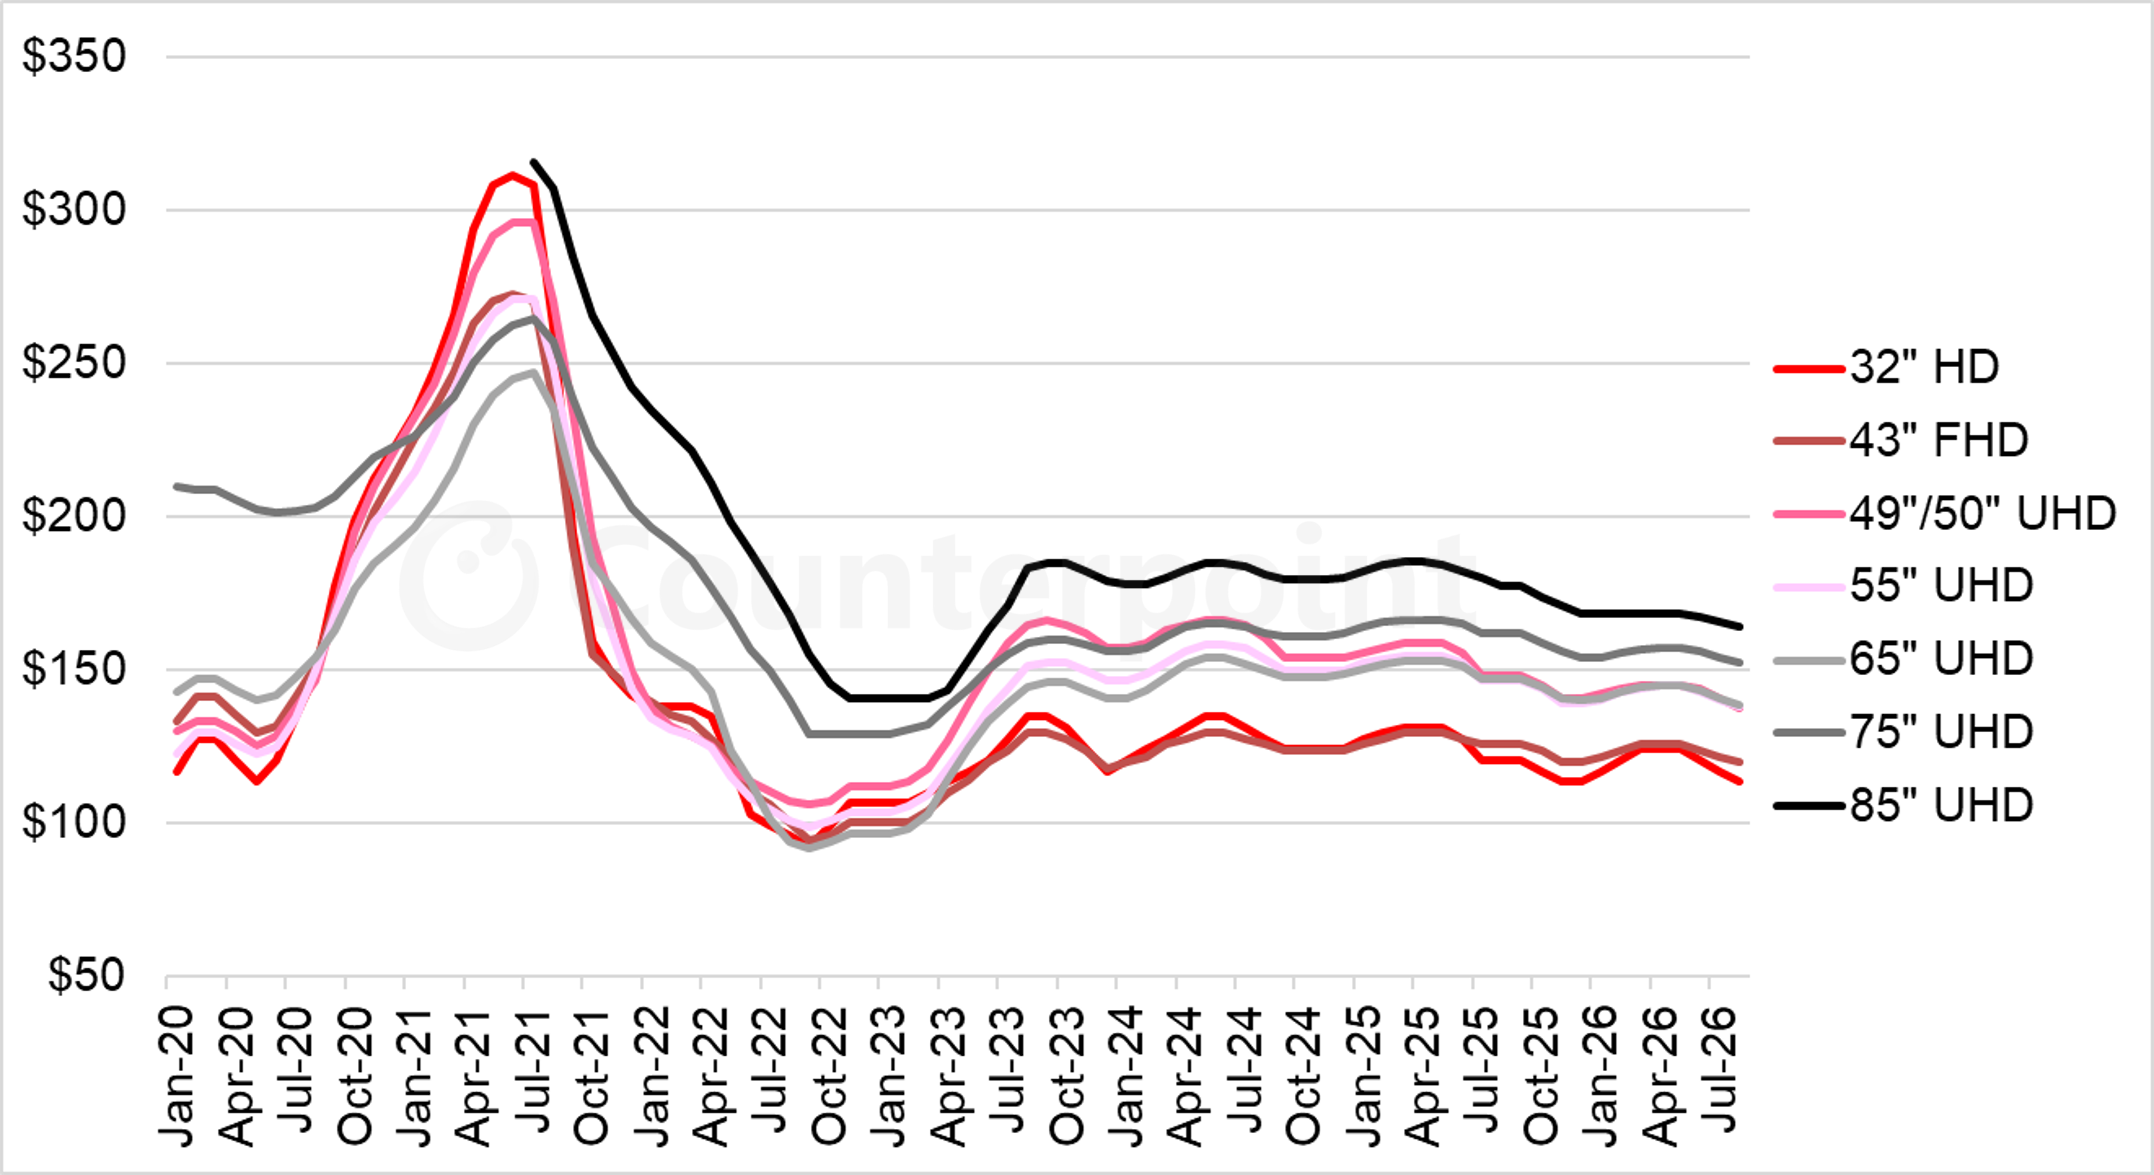
As we look at pricing in terms of area, it has now been nearly three years after the pandemic boom and bust that prices have stayed within a narrow range. In this period of stability, the products fall into three levels:
- The lowest-priced products are 32” and 43”, the most commoditized sizes. 32” panels seem to be the first size to increase, but also the first size to decline, and we are seeing that in the first half of 2026, as 32” prices had the biggest percentage increase in Q1 and are expected to have the biggest percentage decrease in June. These two products are efficient 18 cuts per substrate on Gen 8.5 (32”) and Gen 10.5 (43”). During the whole period from July 2023 to our forecast out to August 2026, the price of 43” panels has stayed between $118 and $129 per square meter. The 32” panel hit a new post-pandemic low of $113 per square meter in November/December but increased to $124 per square meter in March, and is expected to fall to $113 per square meter in August.
- The mid-tier products are 49”/50”, 55” and 65”, with the largest size usually coming at the highest price. These sizes are also made efficiently on Gen 8.5 (49”/50” 8-up and 55” 6-up) and Gen 10.5 (65” 8-up). These panels have fluctuated between $139 and $167 per square meter and fell near the bottom of that range in December. Prices for each size increased in Q1, but we expect that they will fall to a new low of $137-$138 by August.
- The premium products are 75” and 85”. The 75” panel briefly fell to the mid-tier level in 2023 but has regained a premium of ~$13 over the smaller sizes. In 2025, the 85” panel maintained a premium of $15-$20 per square meter over the 75” panel, but that premium appears to have eroded to about $12 in 2026.
Monthly Area Prices Per Square Meter for LCD TV Panels, Jan 2020 – Aug 2026
Our final chart in this sequence shows our LCD TV panel price index, taking a longer view from 2015 through April 2026. It appears that with each successive wave of price, the peak and trough are a little lower than the previous wave. The price increases in Q1 2025 brought our index up to a peak of 44.8 in March 2025, not quite as high as the peak in 2024 but still 47% higher than the all-time low of September 2022. Prices declined to a low of 40.4 in December, the lowest point since May 2023. We saw the index rising modestly to 42.2 in April 2026, but we expect it to edge down to 40.0 in August 2026.
LCD TV Panel Price Index, Jan 2015-Aug 2026
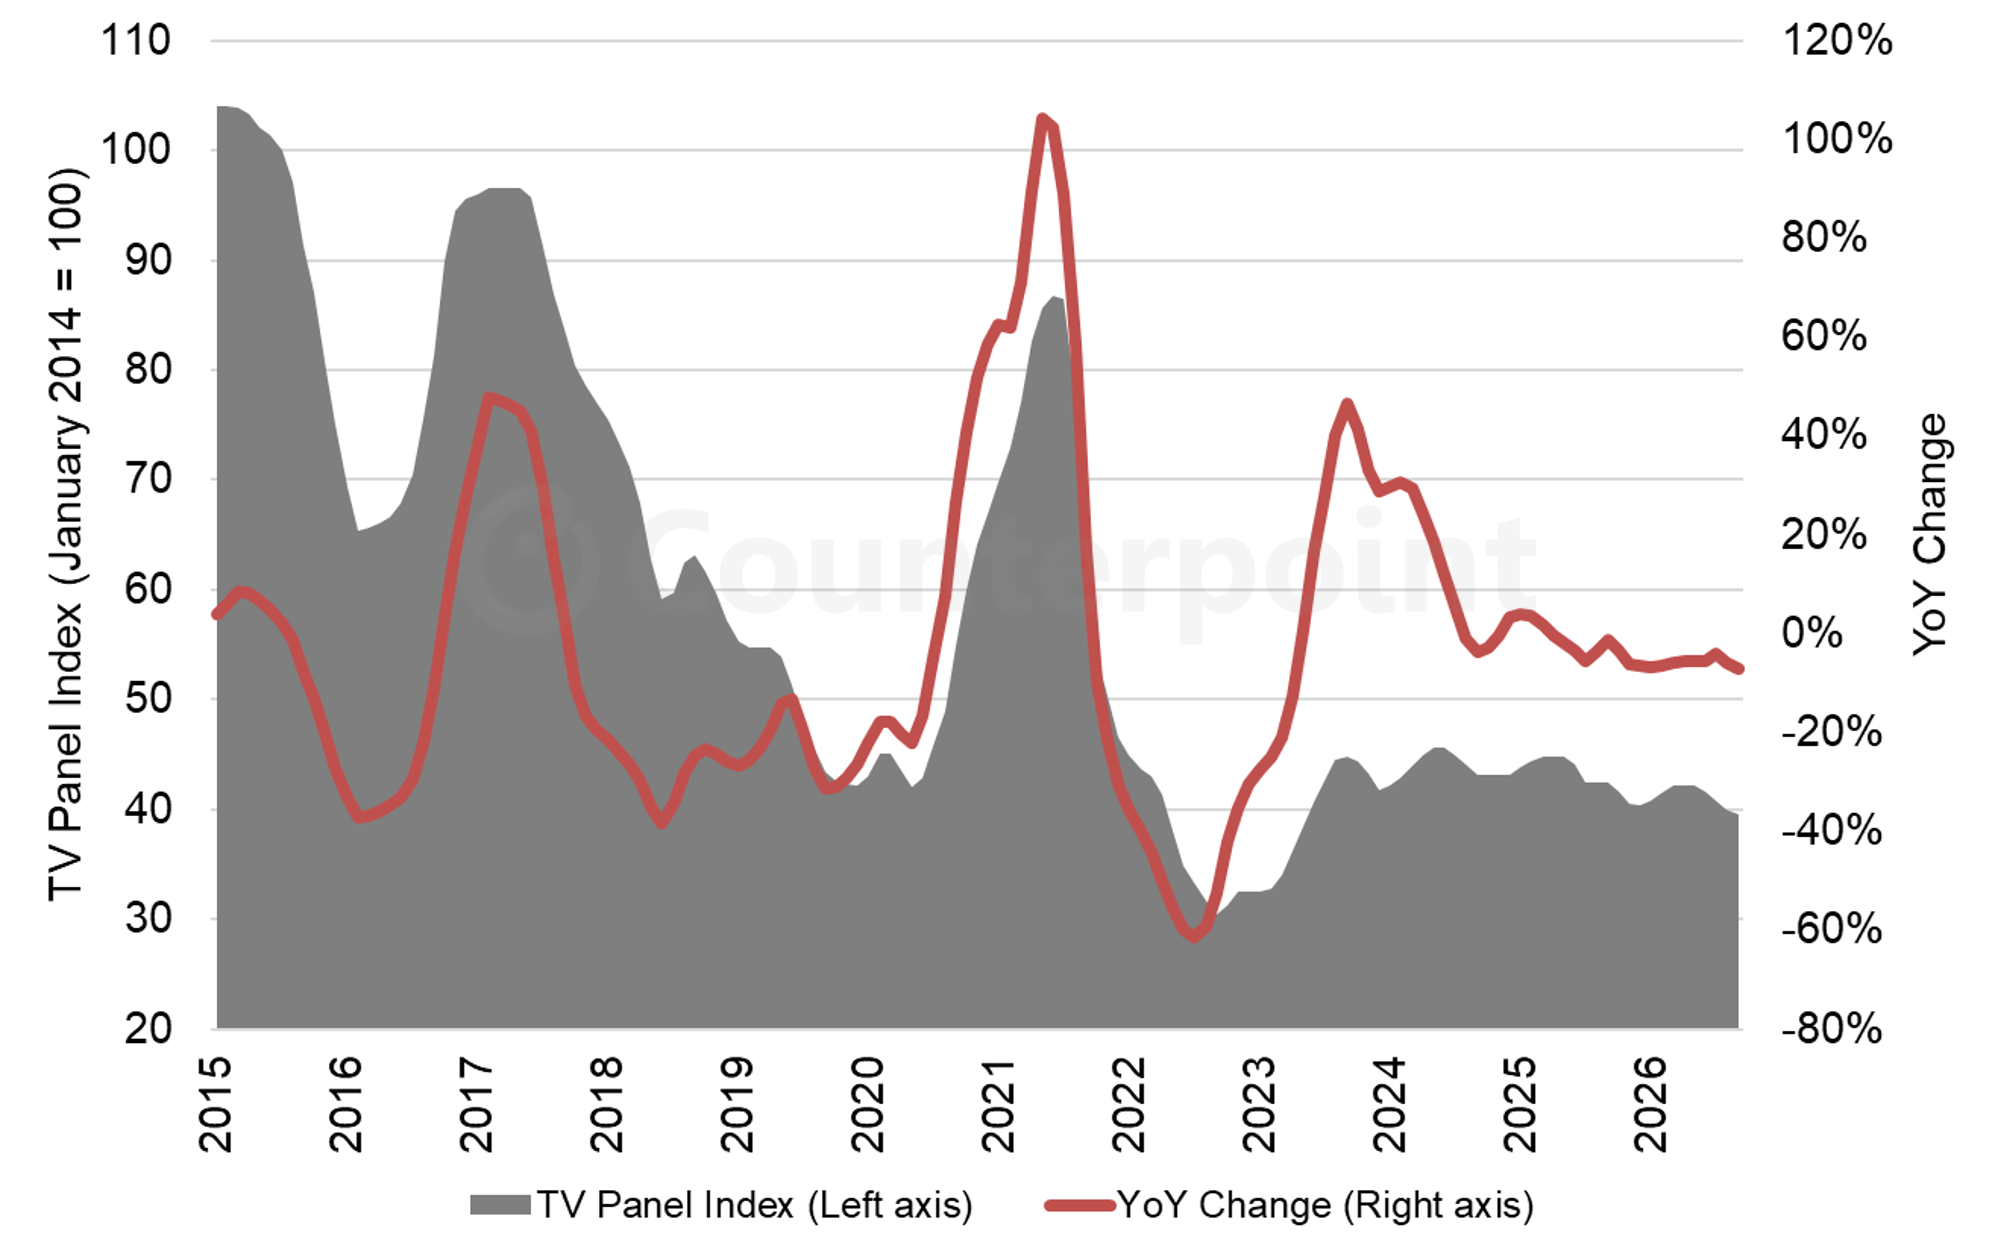
Following the grey area in the chart, we can see that the period from mid-2023 to today is radically different than the period from 2015 to 2023. We no longer have wild swings in prices. As of May 2026, our price index remained within a relatively tight range of 40.4 to 45.6 for 33 months. If our forecast bears out, the price index will break below 40.4 in August, testing the bottom of the range.
Panel prices have been fluctuating around a level that allows the Chinese panel makers, with a cost advantage from government subsidies, to make a small profit, while Taiwanese panel makers come close to breakeven. The profitability of both the Chinese and Taiwanese panel makers increased in the first quarter of 2026, with Innolux reporting its first quarterly operating profit after six consecutive quarterly losses, while AUO just missed breakeven with an operating margin of -1%. Despite our forecast of a panel price decline in June, these panel makers are likely to show slightly improved margins in Q2 2026.
Category
Industry
Display
Service
Display Market Trends
Report Type
Report
Time Period
Weekly
Receive our insightful weekly newsletter and stay ahead of the competition.
Author
Bob Obrien
Robert J (Bob) O’Brien joined Counterpoint Research as part of its acquisition of DSCC, where he was Co-Founder, Principal and CFO of DSCC. Bob has decades of experience turning market and business analysis into strategic insights in the display and electronics industries. At DSCC, Bob takes the lead role in analysis of display materials, including glass and AMOLED materials, and covers developments in TV and other large-screen display applications. He is the principal author of DSCC’s AMOLED Material Report, the Advanced TV Shipment Report, and the Display Glass Report, and Bob contributes regularly to the DSCC Weekly Review.