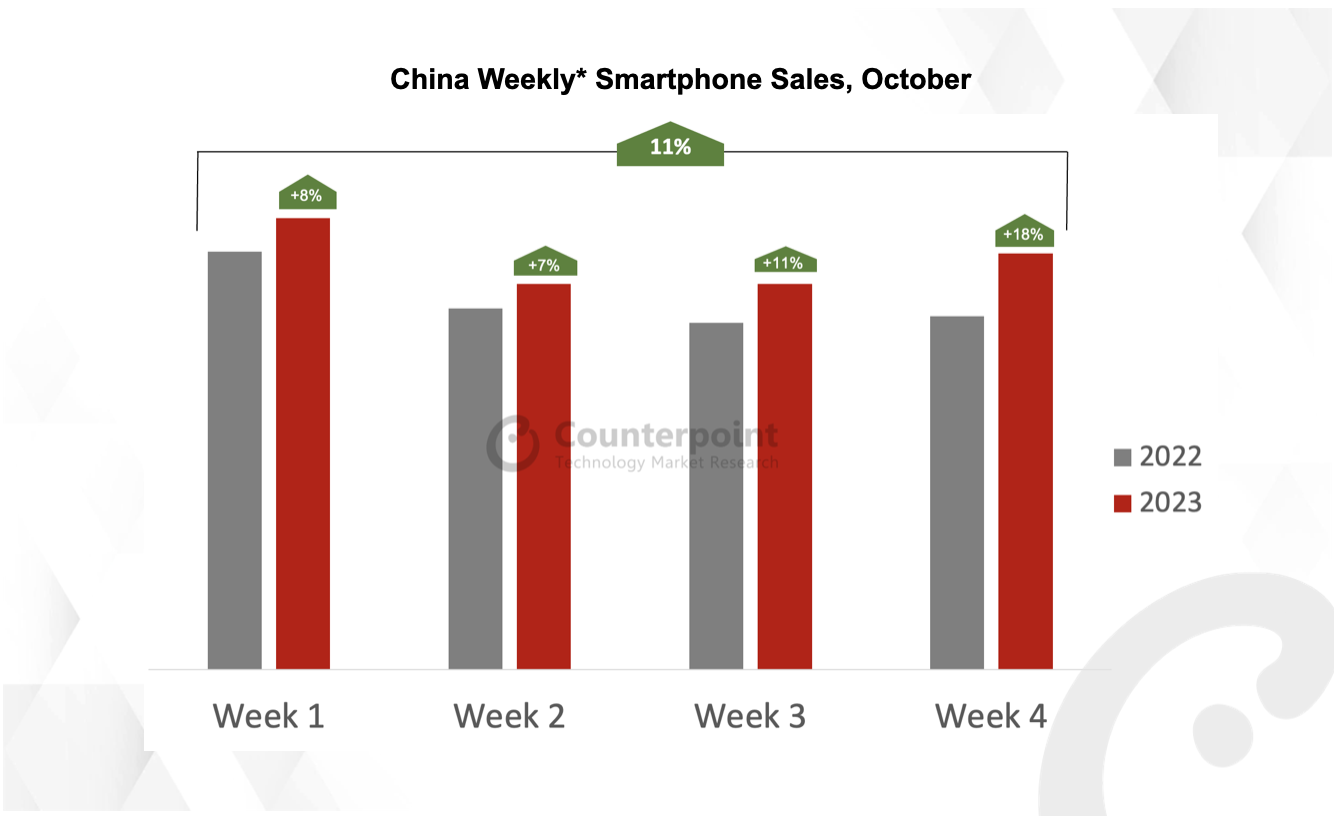
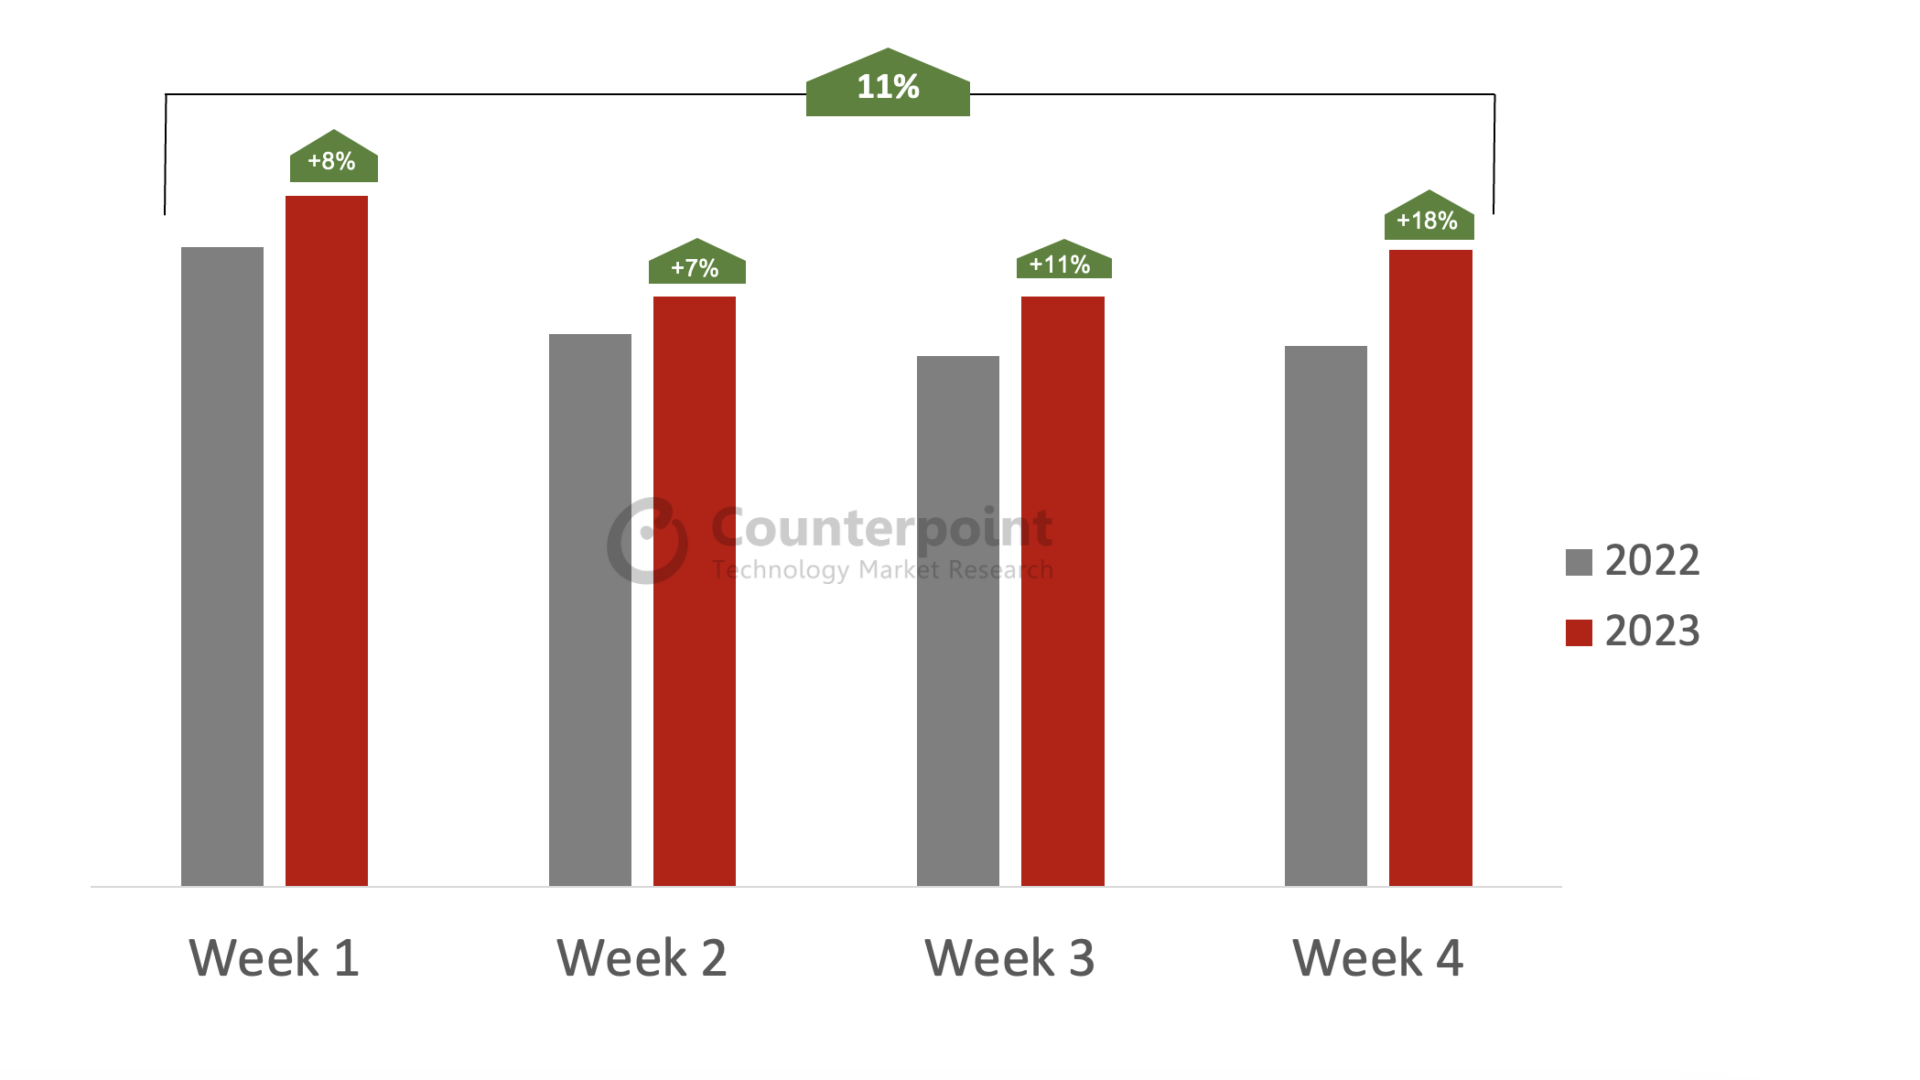
Growth: China’s YoY smartphone sales growth for the first four weeks of October averaged 11%
Growth: WoW figures heading into 11.11 sales period highlight stronger momentum than 2022
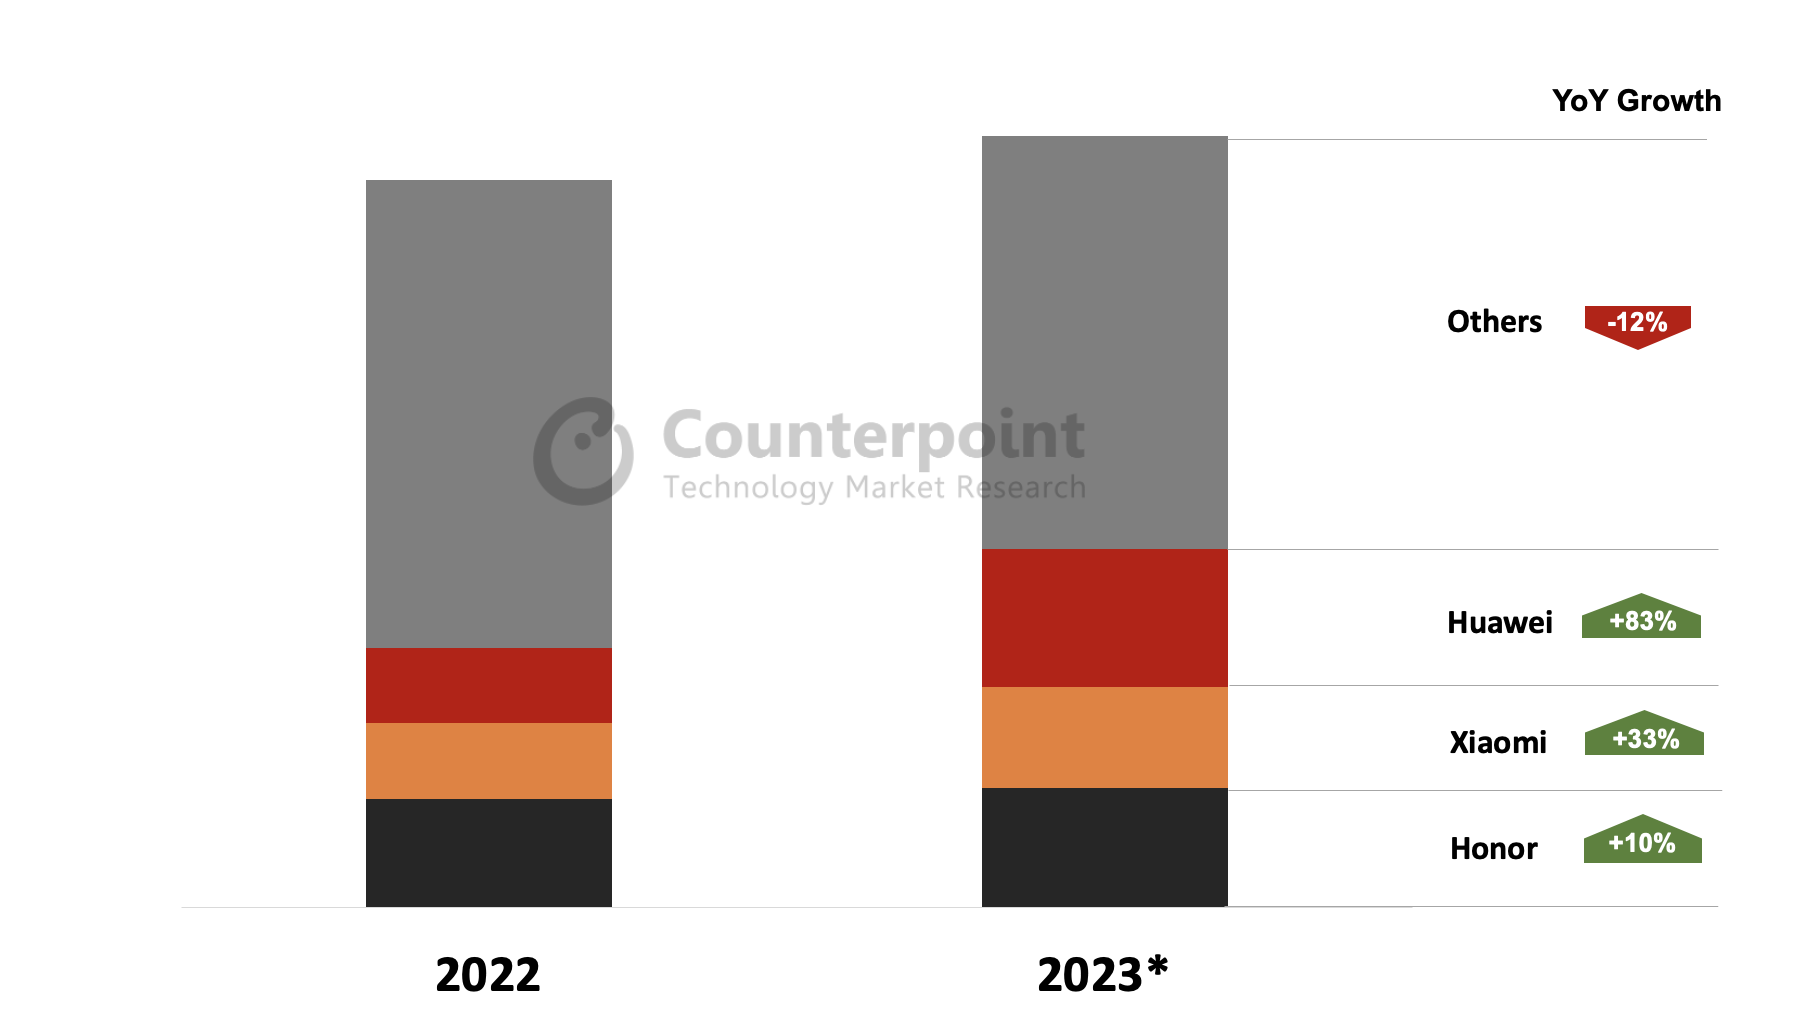
Drivers: Huawei the standout brand, growing by over 90% during the four-week period
Drivers: More transparent and earlier promotions ahead of the 11.11 Singles Day sales event
Expectations: Positive momentum across both WoW and YoY
Beijing, Hong Kong, Seoul, Boston, New Delhi, London – November 14, 2023
China’s smartphone market is signalling a recovery with the first four weeks of October growing on average 11% YoY according to Counterpoint Research’s latest Smartphone 360 Weekly Tracker. Huawei has been the standout brand, accounting for the bulk of net adds share over the period.
“Whether it’s YoY or more short-term WoW, the numbers are suggesting a recovery. There’s some momentum building to be sure,” observes Mengmeng Zhang, senior analyst for China. “This is auspicious as we head into reporting season for the 11.11 sales period.”
China Weekly* Smartphone Sales, October
Source: Counterpoint Research Smartphone 360 Weekly Tracker, China. *Based on first four weeks (Mon-Sun) in October.
With the launch of its new Kirin powered device, Huawei is making a resurgence. “The clear standout in October has been Huawei with its turnaround on the back of its Mate 60 series devices. Growth has been stellar with its new launch marketing and strong media coverage around its ‘Made in China’ chipset,” notes China analyst Archie Zhang. “Demand continues to be high double-digits and we’re also seeing a halo effect, with other models from the vendor performing well.”
China Smartphone Sales by Key Vendors, October*
Source: Counterpoint Research Smartphone 360 Weekly Tracker, China. *Based on October full-month preliminary figures.
Production issues are a recurring theme this year, with both Huawei and Apple coming under pressure to deliver on new devices. The latter is experiencing some issues with specific color variants on the Pro Max, resulting in extended wait times and higher prices on some e-commerce platforms.
Huawei stock shortages are the result of much higher-than-expected demand and the resulting strain from its component supply chain and EMS providers. “Huawei’s ability to scale up to this new normal will be a major determinant not just for their own growth, but for the broader market,” states Ivan Lam, senior analyst for manufacturing. “How they managed the 11.11 period is Huawei’s first true test. Indicators are showing overall sales to be up but how much Huawei contributed to that outperformance is the tell for the rest of the quarter.”
Background
Counterpoint Technology Market Research is a global research firm specializing in products in the TMT (technology, media and telecom) industry. It services major technology and financial firms with a mix of monthly reports, customized projects and detailed analyses of the mobile and technology markets. Its key analysts are seasoned experts in the high-tech industry.
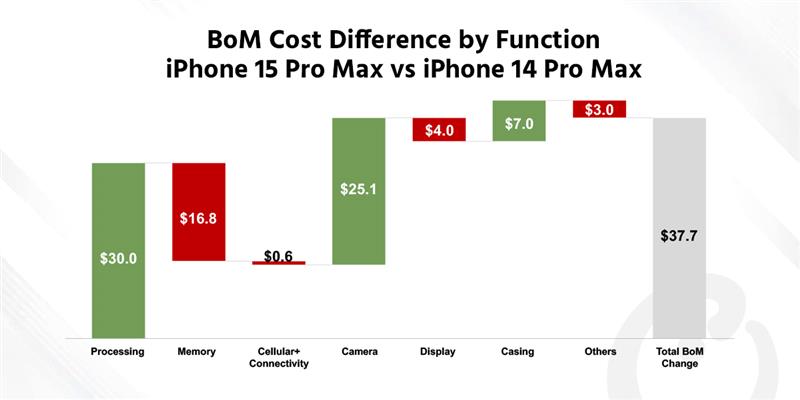
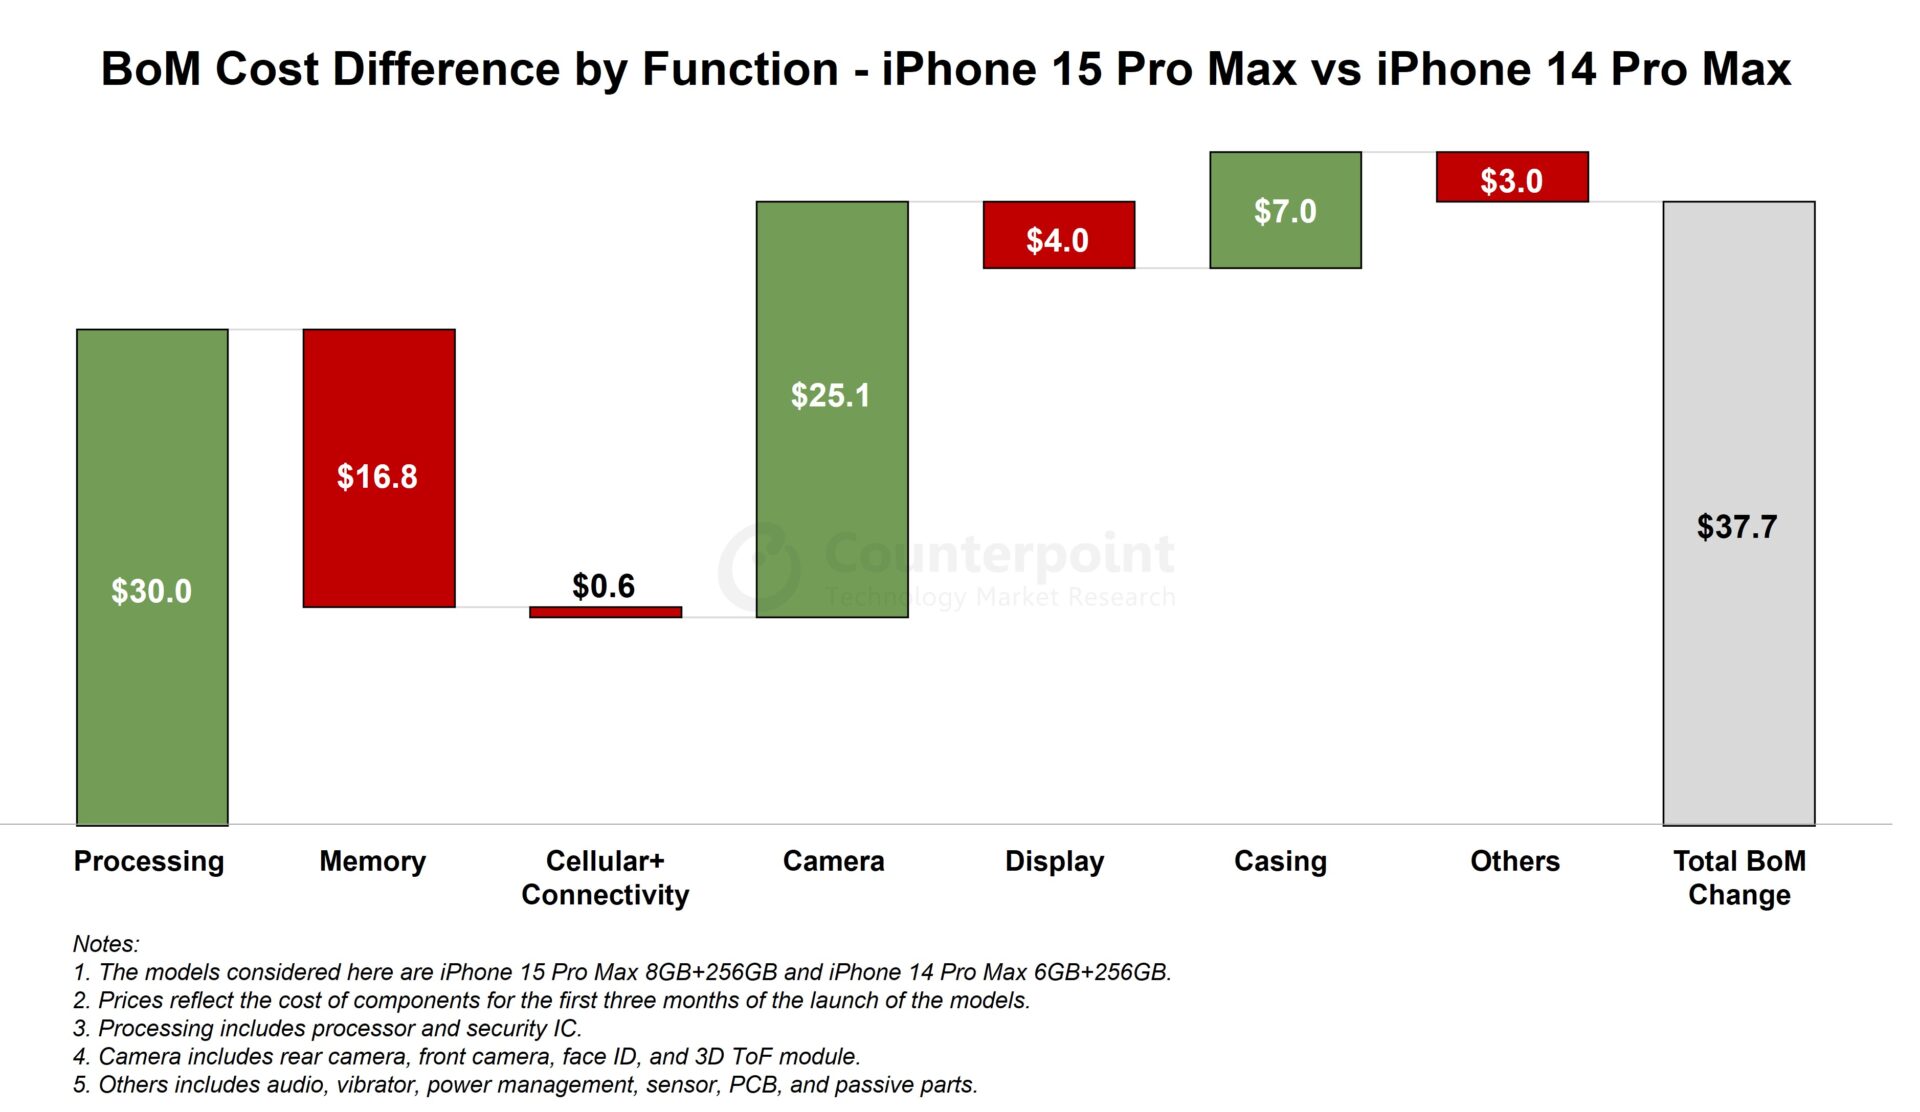
The industry’s first 3nm-powered SoC A17 Pro, innovative 5x telephoto camera, and a redesigned titanium central panel are major areas of BoM cost increase.
Memory and display are among the areas where cost has fallen.
Share of Apple’s self-designed components has increased to 25% of the total BoM cost.
The iPhone 15 Pro Max is Apple’s most advanced flagship model to date. It nicely segments the portfolio for Apple’s power users who are always looking out for the best iPhone experience. Apple has differentiated its top model with the most advanced processor, a unique telephoto camera system and a lighter titanium-based casing design. This has also made the iPhone 15 Pro Max costlier than its predecessor.
The total bill of materials (BoM) cost to produce an 8GB+256GB iPhone 15 Pro Max comes to $37.7 or 8% higher than that for the 6GB+256GB iPhone 14 Pro Max launched last year, according to Counterpoint Research’s Teardown and BoM Analysis Service. With an increase of $100 in the starting retail price, the iPhone 15 Pro Max is expected to give Apple more profit as it has the highest gross margin in the iPhone 15 family, despite being the costliest model.
Source: Counterpoint Research’s Smartphone Teardown and BoM Analysis
Where the costs have risen
First 3nm process-powered application processor: Apple’s new-generation mobile platform, the A17 Pro, uses TSMC’s most advanced 3nm fabrication technology and packs more than 19 billion transistors in a die, 18% more than that of the A16 Bionic. Thanks to the improved 6-core GPU architecture, the iPhone 15 Pro Max’s GPU performance is 20% faster. As a result, the A17 Pro can deliver vastly improved gaming performance with a breakthrough in enabling real-time 3D ray tracing. However, this SoC upgrade has resulted in a cost increase of around $30 compared with the A16.
Apple’s first 5x telephoto camera: Another notable upgrade is the 5x telephoto camera featuring an equivalent 120mm focal length. This camera consists of a quadruple reflection prism that enables light rays to bounce four times, allowing users to capture sharper close-up shots from greater distances. Lante Optics is the primary supplier of this prism. Additionally, to match the new telephoto system, Apple has designed the 3D sensor-shift OIS in this camera which can make up to 10,000 micro-adjustments per second, enabling users to capture clearer, sharper photos and more stable videos. The development and assembly of the stabilization mechanism involved a collective effort from Cirrus Logic and LG Innotek. The overall cost of the camera system in the iPhone 15 Pro Max is 34% costlier than that of the iPhone 14 Pro Max.
Titanium alloy casing: Apple has adopted a titanium alloy in the iPhone 15 Pro Max casing frame, which has reduced the device’s weight by around 20 g, making it the lightest Pro Max model ever. The cost of the new casing in the iPhone 15 Pro Max is 18% higher than that of the 14 Pro Max.
Where the costs have fallen
Memory: Apple has upgraded the iPhone 15 Pro Max’s DRAM to 8GB, which is 2GB higher than that of its predecessor. However, the global memory market was in a downtrend from Q4 2022 to Q3 2023, both DRAM and NAND flash prices have decreased by more than 30%. This has worked in favor of Apple, helping it offset some of the other cost increases as the contribution of memory chips dropped by 34% compared to the iPhone 14 Pro Max.
Display: The display price is also in a downtrend. Apart from Samsung Display, LG Display has also started supplying iPhone LTPO displays. This has contributed to a reduction in display costs by 4% in the iPhone 15 Pro Max compared to that of the iPhone 14 Pro Max.
Rising share of self-designed components
Apple’s vertical ambitions are evident as its self-designed components, such as the processor, the upgraded UWB and power management ICs, are playing an increasingly significant role in the overall BoM cost of the iPhone 15 Pro Max, garnering Apple great economies of scale and control over the performance and end-user experience. Our estimates indicate that these self-designed components account for 25% of the total BoM cost of the iPhone 15 Pro Max, up from 22% in the iPhone 14 Pro Max last year.
Key takeaways
Apple has grown to a level where it has significant control over design, innovation, scalability, costs and profits of the entire iPhone and the other products in its portfolio.
This is helping Apple with differentiation and is also allowing it to exercise not only significant selling power but also buying power through great vertical design expertise and sourcing of components.
Also, having the most powerful smartphone SoC manufactured at the most advanced process node has allowed Apple to design an SoC with high-performance CPU, pro-class GPU and dedicated neural engines to build pervasive AI experiences, efficiently blending with its vertical software (OS) capability and (apps) ecosystem.
Apple is, thus, raising the table stakes for competition with its flagship, which is set to be the most lucrative iPhone in terms of top line and bottom line.
Background
Counterpoint Technology Market Research is a global research firm specializing in products in the technology, media and telecom (TMT) industry. It services major technology and financial firms with a mix of monthly reports, customized projects and detailed analyses of the mobile and technology markets. Its key analysts are seasoned experts in the high-tech industry.
Pre-order delivery wait times for iPhone 15 base and Pro Max models significantly higher than previous generation
High demand coupled with initial supply constraints likely factors driving Pro Max’s delivery times to record high during pre-order week
iPhone 15 base model also seeing high wait times; China at 4X that of iPhone 14.
Boston, Seoul, Beijing, New Delhi, London – September 25, 2023
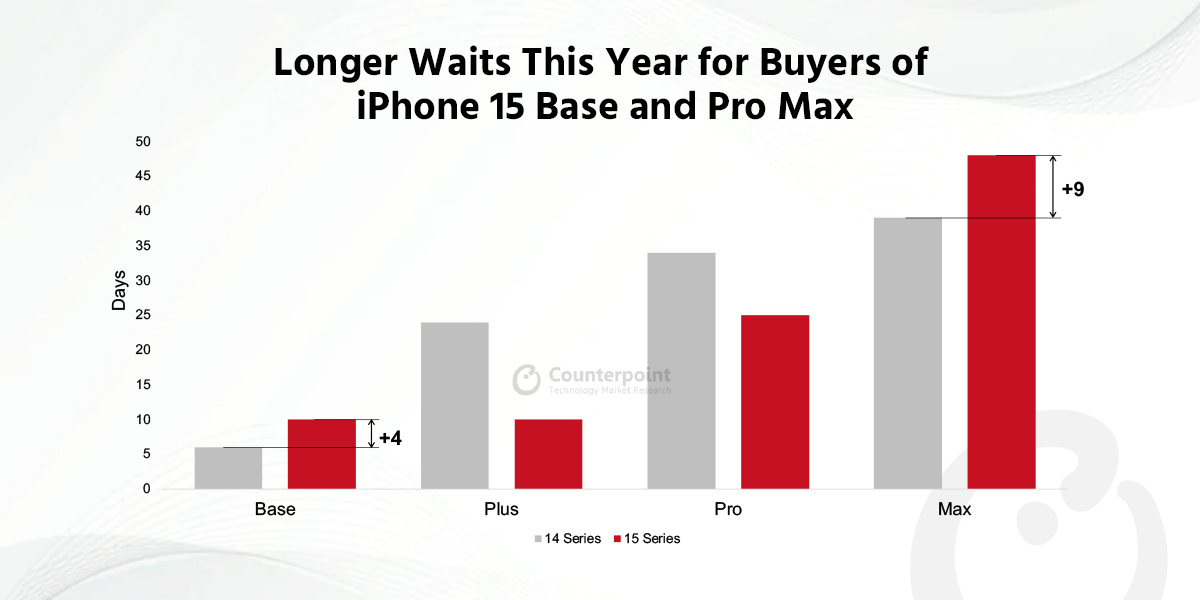
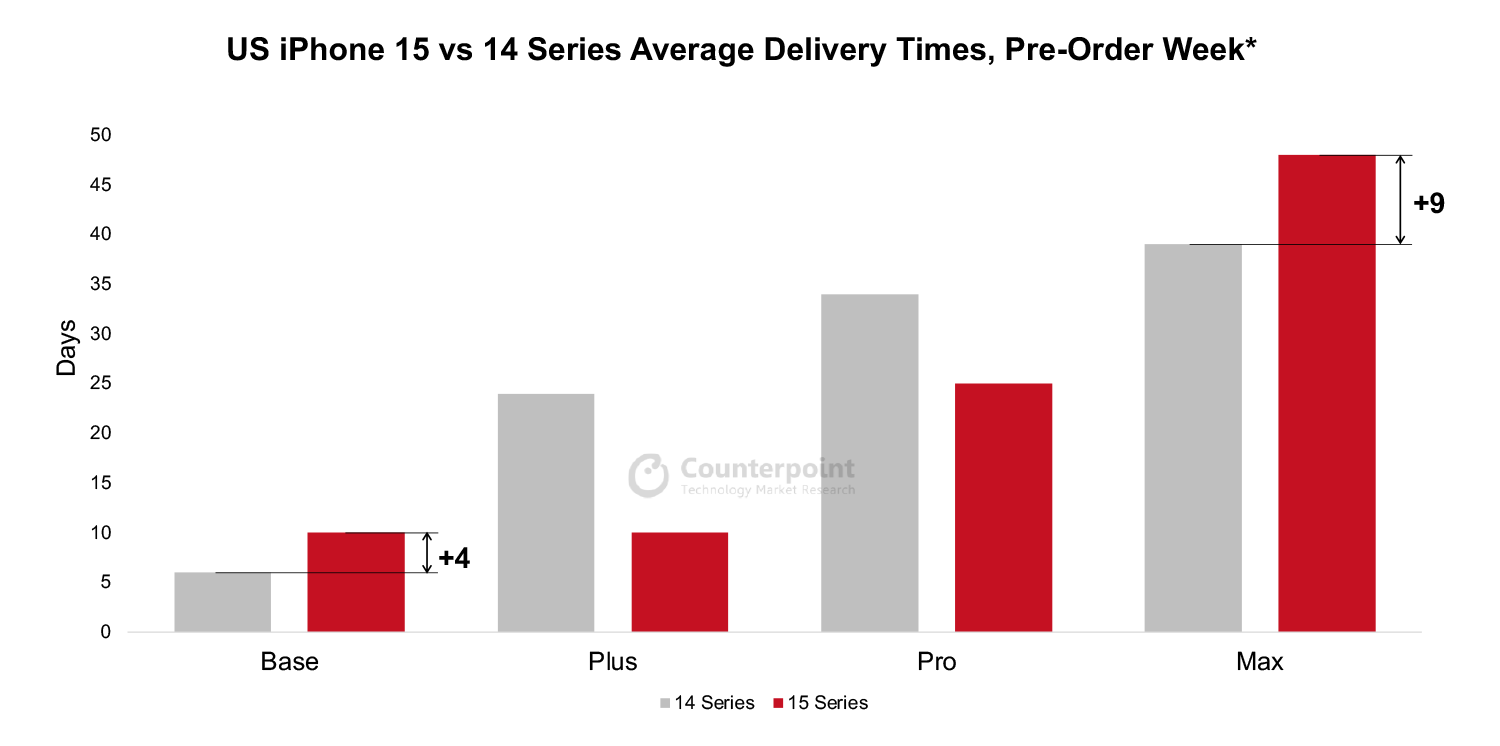
Delivery times on pre-orders for the iPhone 15 and 15 Pro Max came in significantly higher than corresponding iPhone 14 models across key markets, according to Counterpoint Research’s Apple 360 Service. The US was a prime example, with buyers of the base and top-end model having to wait 4 and 9 days longer, respectively, than those last year; Plus and Pro buyers will receive their devices up to two weeks faster.
Source: Counterpoint Research Apple 360 Service. *iPhone 15: Sep 15 – 21, 2023 and iPhone 14: Sep 9 – 15, 2022; excludes weekends. Note iPhone 14 Plus available from Oct 7, 2022 vs Sep 16, 2022 for other iPhone 14 models.
“I don’t think it’s a big surprise the Pro Max is showing longer wait times than its predecessor,” says Senior Analyst, Manufacturing, Ivan Lam. “It’s normal to experience hiccups when you’ve got significant upgrades on complex mechanisms like the camera module. But looking at wait times this weekend as the product starts selling in stores, it looks like availability is moving in the right direction and normalizing.”
Commenting on the iPhone 15, Jeff Fieldhack, Research Director for North America, notes, “The introduction of premium features like Dynamic Island previously exclusive to the Pro lineup has really increased its appeal to the general consumer base. It’s basically an iPhone 14 Pro at base level price and paired with the new aesthetic updates has created more incentives for users to upgrade this year.”
In the run up to Friday’s general release, the base model saw stronger than expected wait times in China, where domestic competitors are jostling to grab share in the premium segment which has been relatively unaffected by the overall market malaise. Most notable has been the rise and popularity of flip-style foldables as well as Huawei’s much anticipated launch of its Mate 60 Pro, which some are seeing as a direct competitor to the iPhone.
“What’s a bit surprising are the base model iPhone 15 wait times in China, which were 4X more than last year on launch day. We were expecting them to come in a lot lower – maybe on par with last year – based on all the discounting we saw on the 14 series during H1,” reflects Archie Zhang, Research Analyst, China. “But it could just be a sign Apple’s still ramping up supply as we move into the busiest quarter.”
“And as far as ultra-premium is concerned, the Pro Max is still the most coveted iPhone in China with long delivery wait times reflecting this,” adds Zhang. “But they’re similar to last year at the moment, and with scalper premiums way down, it could be a combination of less appetite for impulse buying amongst consumers and a similar demand-supply profile as last year.”
Background
Counterpoint Technology Market Research is a global research firm specializing in products in the TMT (technology, media and telecom) industry. It services major technology and financial firms with a mix of monthly reports, customized projects and detailed analyses of the mobile and technology markets. Its key analysts are seasoned experts in the high-tech industry.
Although overall global smartphone shipments declined in Q2 2023, global foldable shipments rose.
In H2 2023, competition in the global foldable product market is set to escalate significantly, driven by the earnest entry of Chinese companies like OPPO and HONOR.
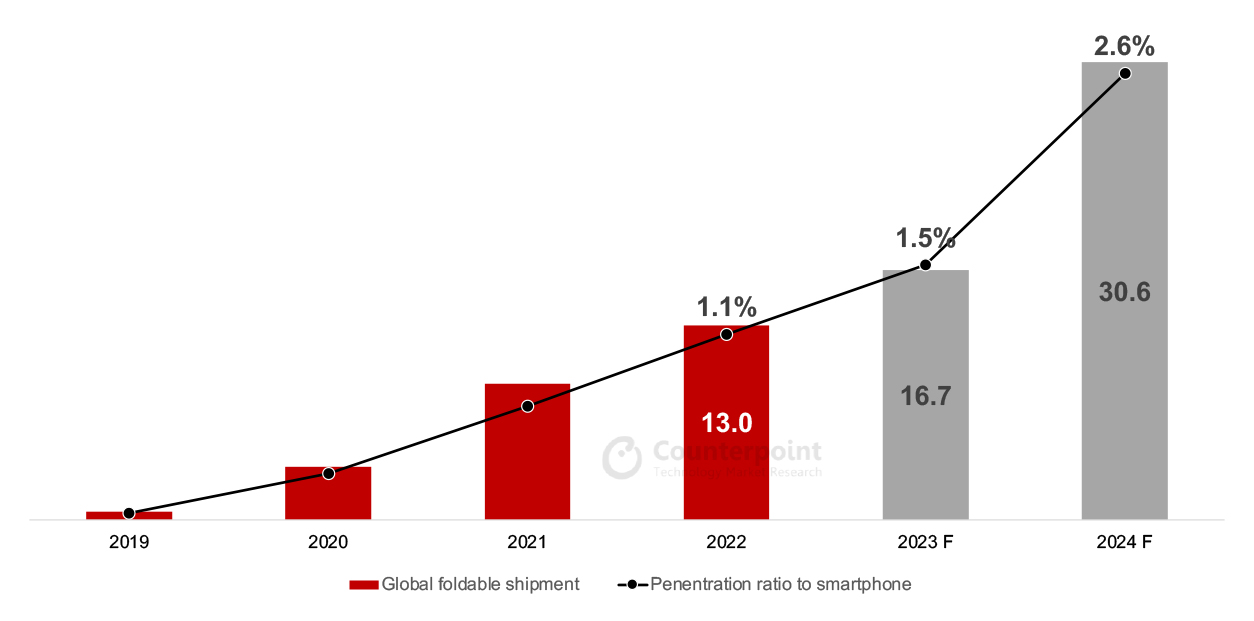
The global foldable market is expected to experience substantial growth in 2024, driven by the introduction of entry-level foldable products.
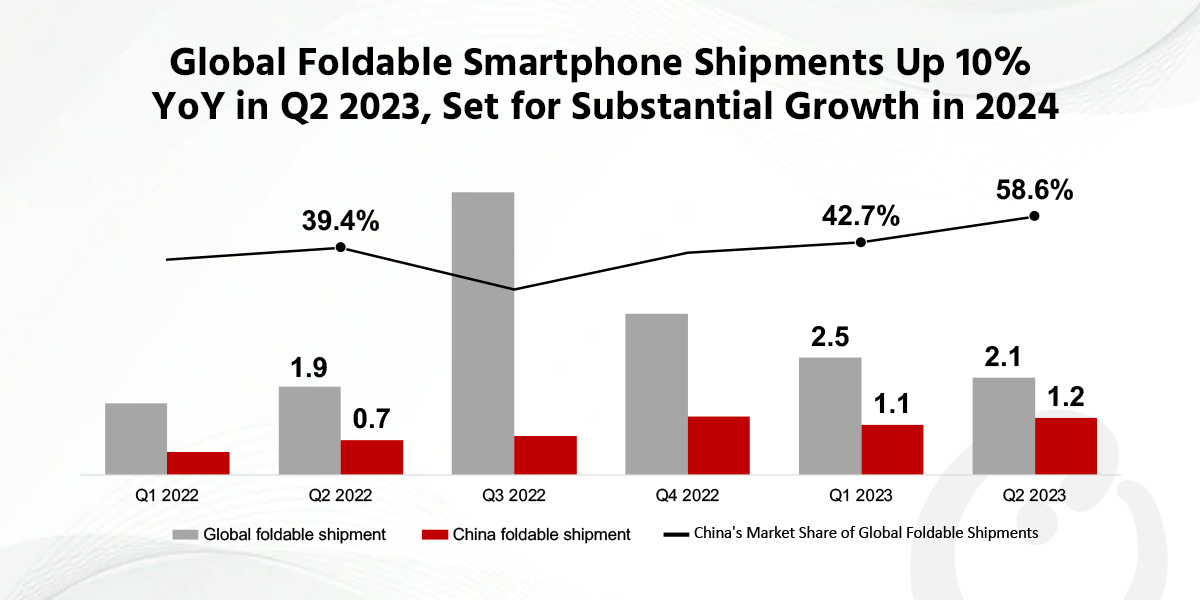
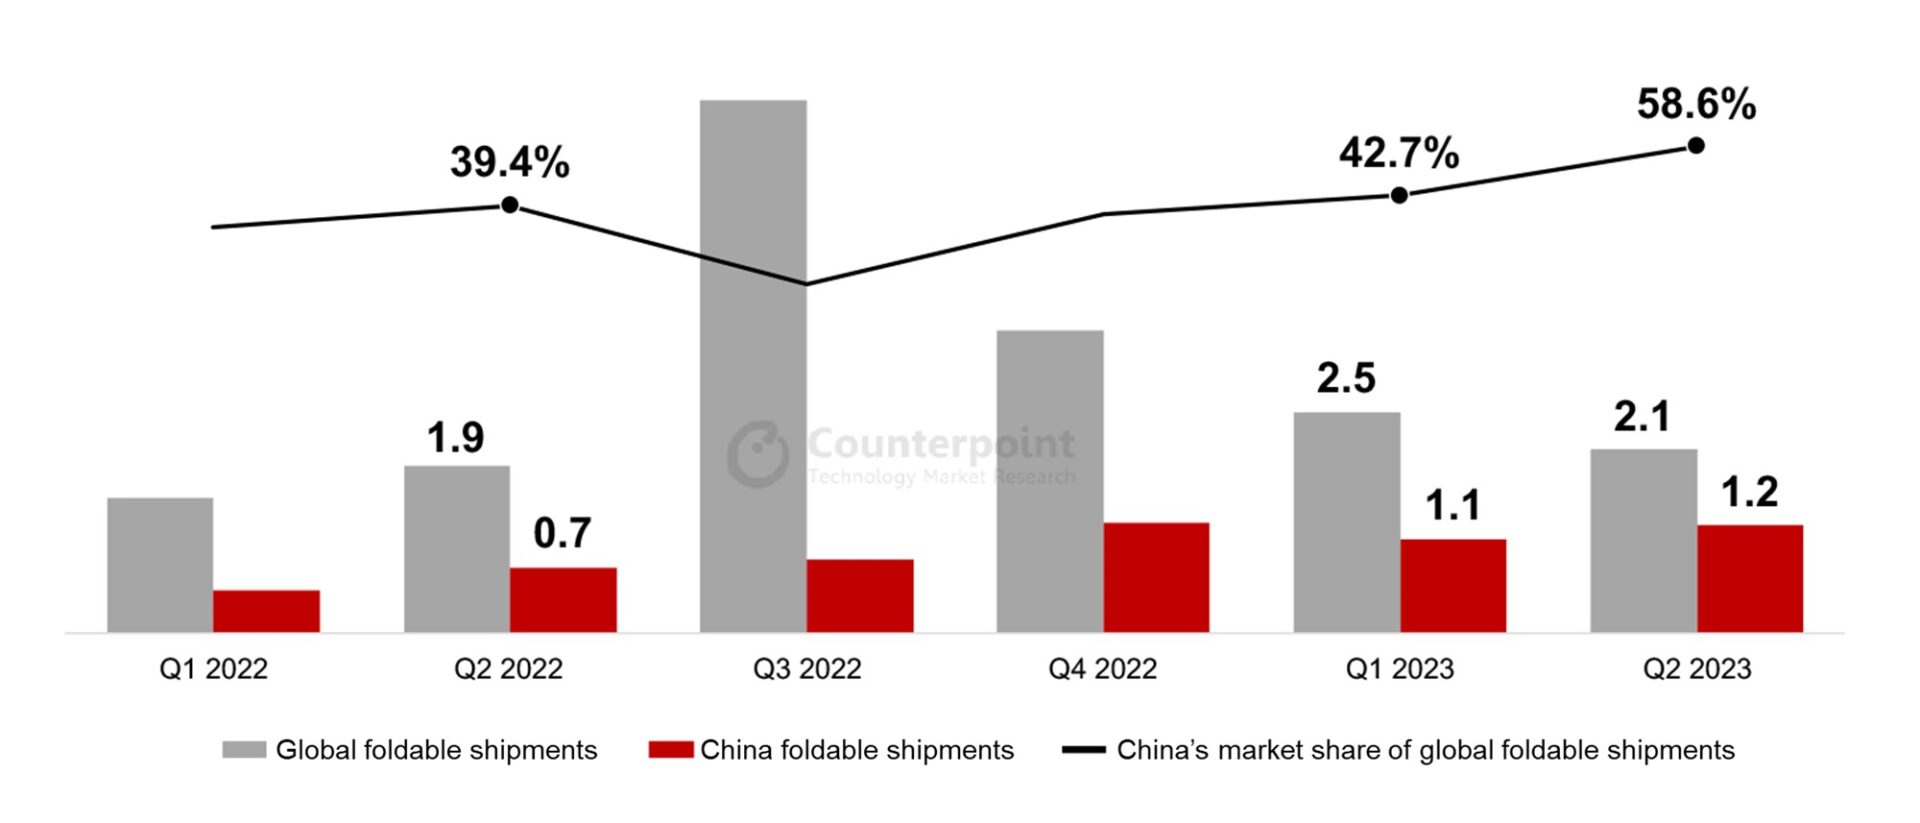
The global foldable smartphone market increased 10% YoY in Q2 2023 to reach 2.1 million units, according to Counterpoint Research’s most recent global foldable smartphone tracker. This growth is in stark contrast to that of the global smartphone market, which showed a 9% decline in shipments during the quarter to reach 268 million units. Due to the prolonged Russia-Ukraine war and the ongoing high global inflation, the smartphone market is expected to grow sideways. Nevertheless, the foldable smartphone sector continues to exhibit robust and sustained growth.
Global and China Foldable Smartphone Shipments, Q1 2022-Q2 2023
The foldable smartphone landscape in the Chinese market presents a particularly intriguing scenario. During Q2 2023, shipments in the overall Chinese smartphone market slipped 4% YoY to reach 61.9 million units, hurt by the recent economic challenges faced by the country, which led to a reduction in consumer spending. However, the Chinese foldable smartphone market achieved notable success, surging 64% YoY to reach 1.2 million units. China now commands the largest share of the global foldable smartphone market, with a 58.6% share.
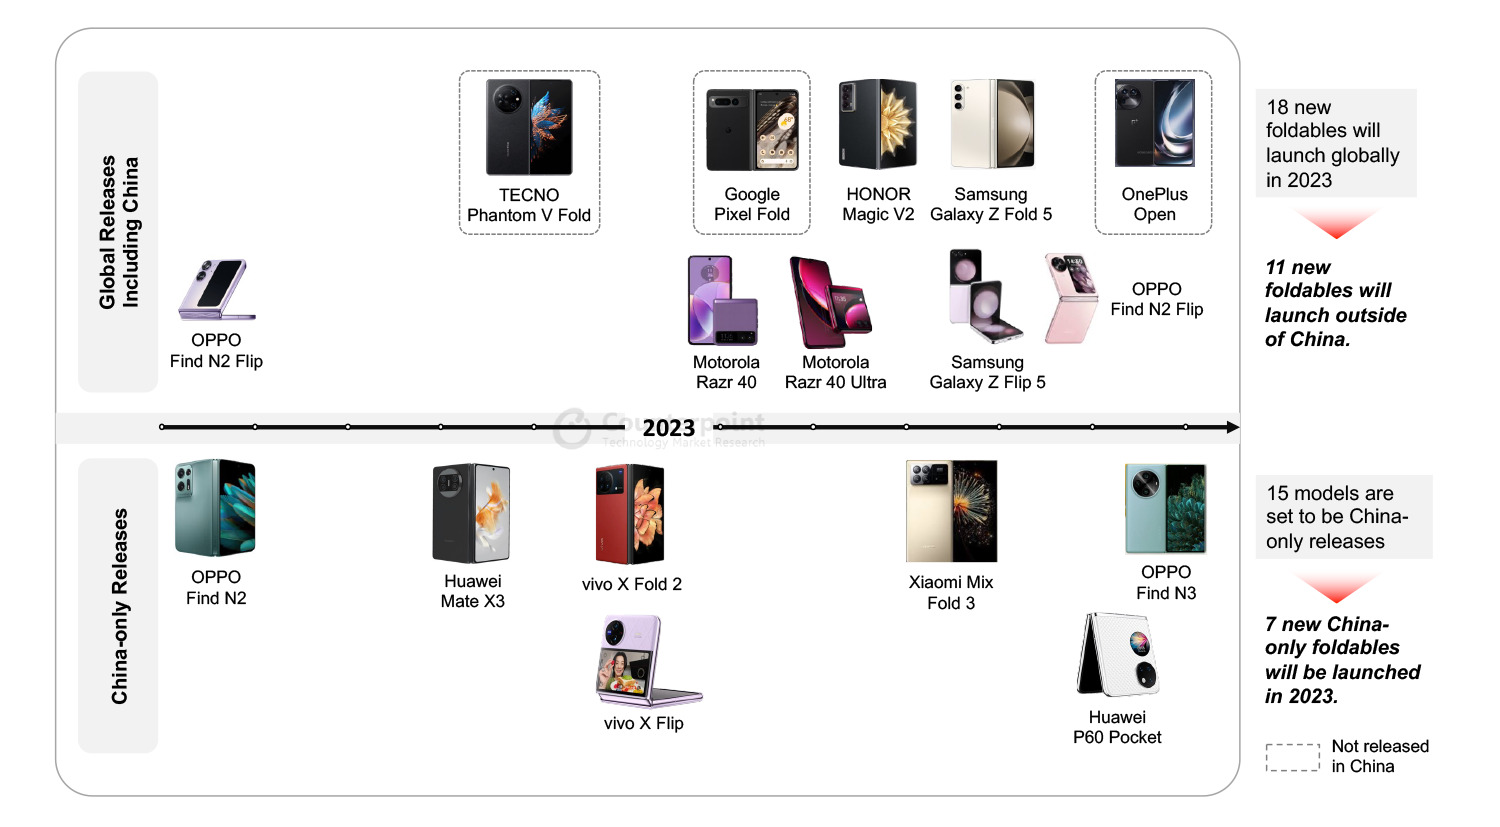
Foldable Product Launch Status in 2023: Comparison of Global and Chinese Foldable Markets
The rapid growth of the Chinese foldable market is primarily attributed to the introduction of foldable products tailored for the Chinese market, coupled with a strong demand for these products among Chinese consumers. In Q2 2023, significant momentum is building for the continued growth of the foldable market. This surge was driven by the introduction of key products such as the Huawei Mate X3, vivo X Fold 2, and vivo X Flip, primarily targeting the Chinese foldable market. Additionally, the global (including China) launch of the Motorola Razr 40 and Razr 40 Ultra, further contributed to this growth trend. In Q2 2023, China saw the launch of five new foldable products tailored for its market, while the global market outside China only saw two foldable product launches during the same period.
Counterpoint Research Senior Analyst Jene Park said, “We believe that these frequent product launches (along with the marketing effects that accompany product launches) are changing Chinese consumers’ perception of foldable products. Consequently, Chinese consumers can access a variety of foldable products more easily and frequently than any other market in the world. The continuous release of various foldable products is recognized as one of the important reasons why the Chinese foldable market has continued to grow significantly compared to other markets.”
The global foldable smartphone market will undergo significant changes in H2 2023. Chinese manufacturers are expanding their presence internationally during this period, with notable releases including the HONOR Magic V2, OPPO Find N3 Flip, and the yet-to-be-named OnePlus foldable device. Notably, Samsung’s Galaxy Z Fold 5 and Galaxy Z Flip 5, considered to be some of the top-tier foldable offerings, were launched in August and are expected to capture a substantial market share in H2 2023.
Park added, “The global foldable smartphone market is set to see significant growth in the H2 2023, driven by the expansion of Chinese manufacturers. Although Samsung’s market share may dip due to increased competition, we believe that it will be a natural result. However, competition among manufacturers usually has the effect of increasing the size of the market for the product. We believe that the era of the mass foldable phone is expected to start in 2024, mainly led by Samsung and Huawei with their entry-level foldables. Entry-level foldables are expected to be priced around $600 to $700, making them more accessible to consumers.”
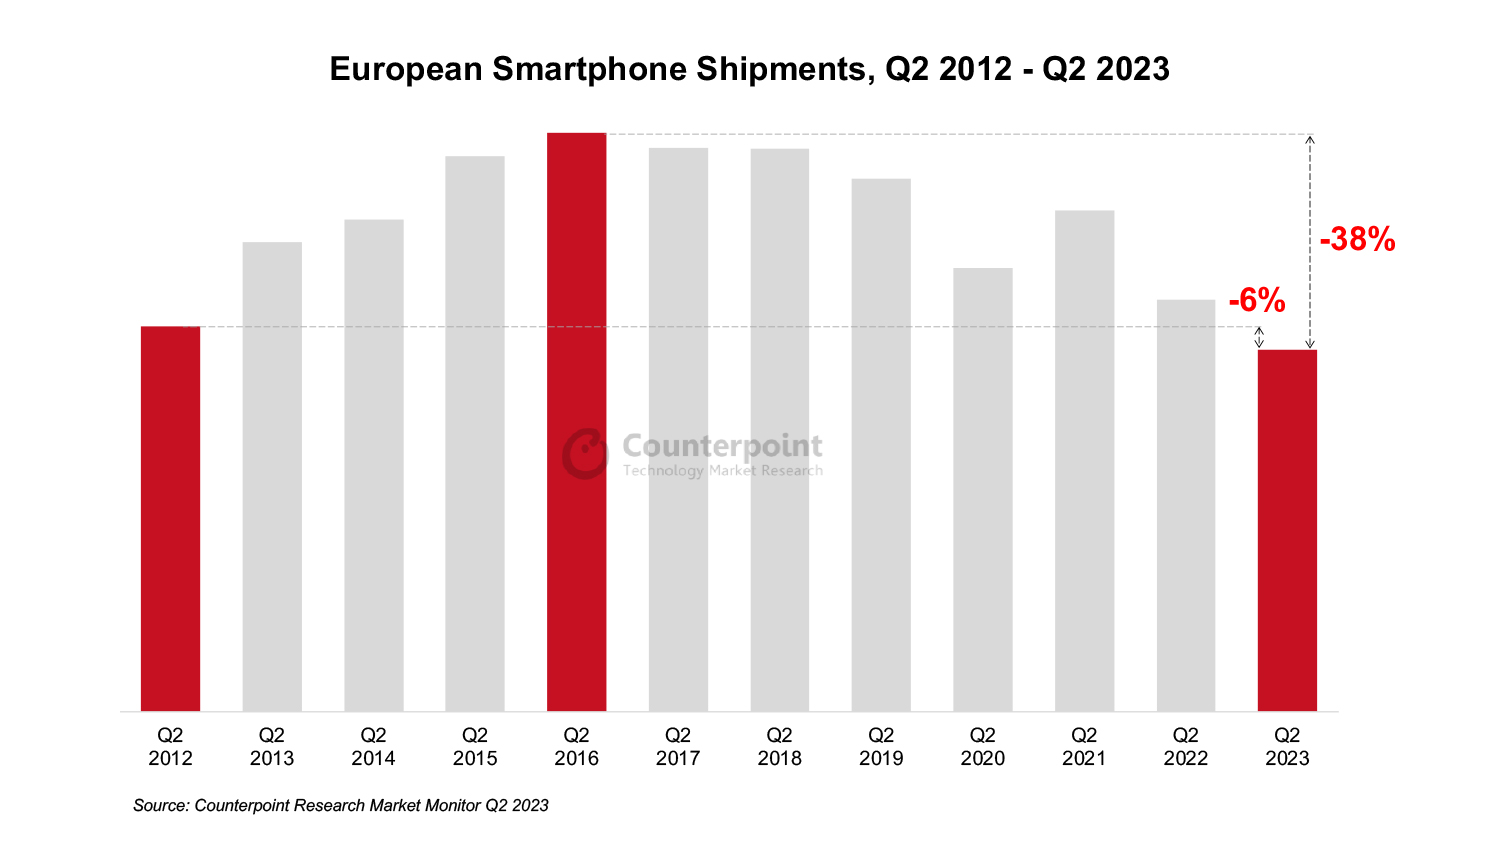
Europe smartphone shipments fell 12% YoY in Q2 2023 to reach lowest since 2012.
Russia only major market to register growth at 4% YoY.
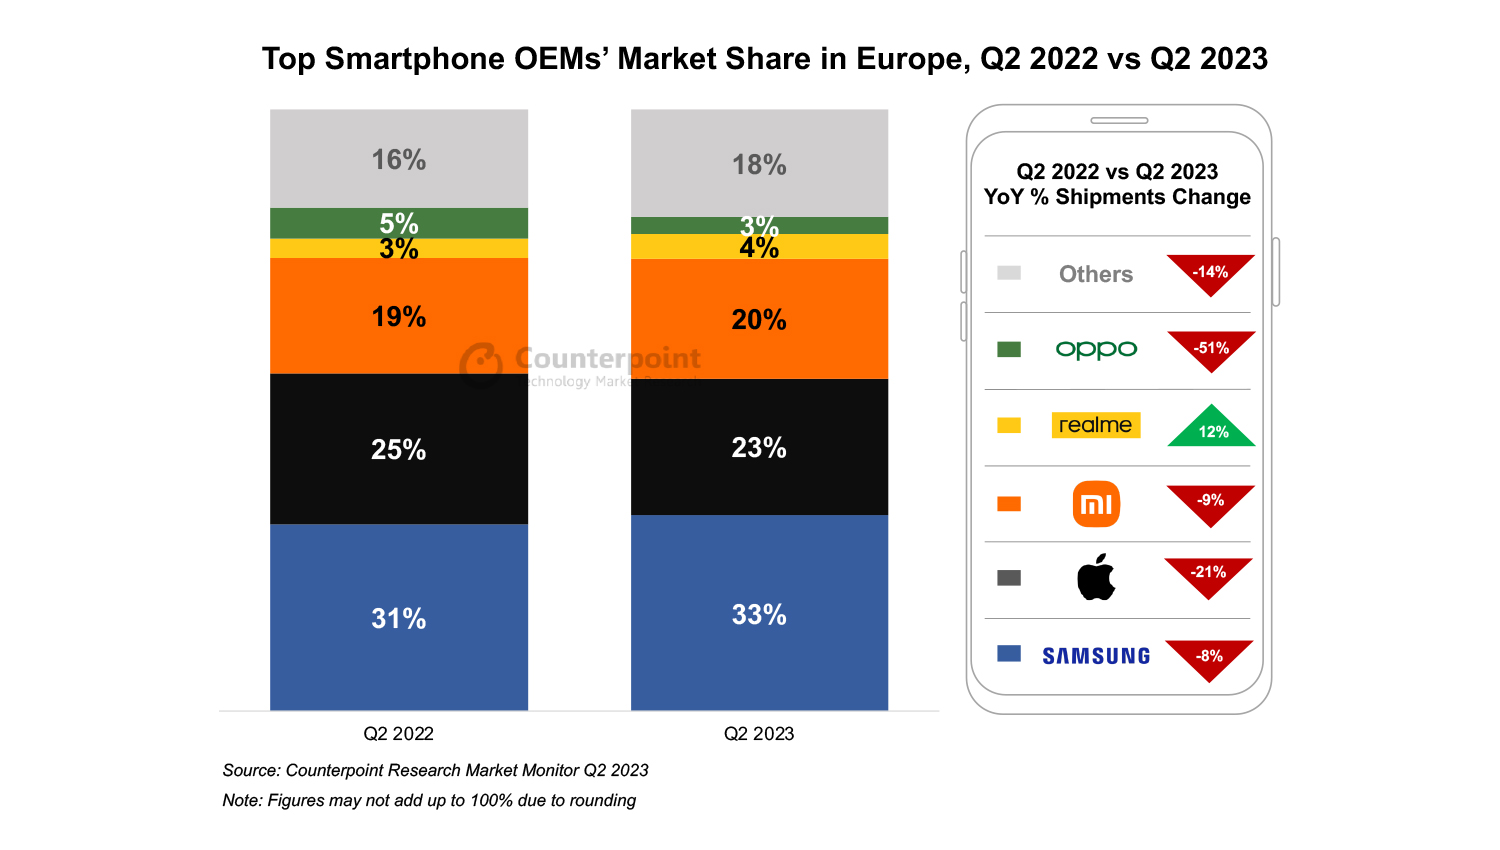
OPPO’s shipments fell 51% YoY hurt by patent issues and difficult market conditions.
2023 smartphone shipments are set to be lower than in 2022.
London, Boston, Toronto, New Delhi, Jakarta, Beijing, Taipei, Seoul – September 1, 2023
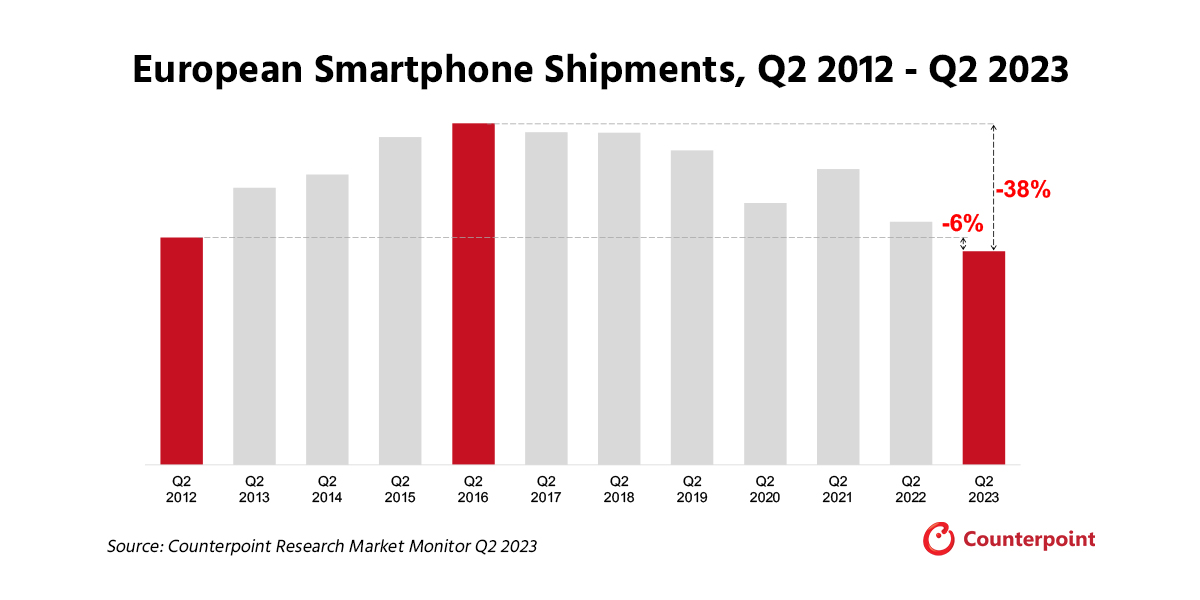
European smartphone shipments declined 12% YoY in Q2 2023, marking the lowest quarterly shipment volume since Q1 2012, according to the latest report from Counterpoint Research’s Market Monitor Service.
Western Europe declined by 14% YoY during the quarter while Eastern Europe limited its fall to 8% YoY, despite being in an already battered state. All major European nations performed weakly in Q2 2023, except Russia, which conversely registered 4% YoY growth. However, this was primarily due to lower shipments in Q2 2022 – the first full quarter after Russia’s invasion of Ukraine and the resulting sanctions and market exits of prominent smartphone players.
OPPO had a difficult time in Q2 2023 with patent disputes and uncertainty in several countries, due to which the brand’s shipments dropped 51% YoY. The uncertainty is likely to persist which will result in further shipment declines in the coming quarters.
realme grew 12% YoY, driven primarily by Russia, which accounted for 55% of the brand’s shipments in the region. In Russia, realme benefitted from Samsung and Apple’s market exit, which allowed the company to fill the void left by these heavyweights. Additionally, realme has remained in the second position in Russia for five straight quarters and has been closing the gap with the market leader Xiaomi.
HONOR registered 9% YoY growth during the quarter due to the base effect and its ongoing expansion outside China.
Commenting on the current market dynamics, Research AnalystHarshit Rastogi said, “Despite falling shipment volumes, the higher price bands (wholesale prices exceeding $600) have been capturing a larger share of the market each year. They also have a longer replacement cycle compared to mid-segment and lower-price band smartphones, which further dampens demand. Consequently, OEMs are likely to focus on increasing their ASP and concentrate on services to drive revenue growth in the coming quarters.”
Commenting on market outlook, Associate Director JanStryjak commented, “The market is unlikely to make a full recovery `this year and 2023 smartphone shipments are set to be lower than in 2022, marking consecutive decade-low shipments in both 2022 and 2023. While the economic conditions are partly to blame, consumer buying behaviour is also changing, suggesting that a lower level of sales will set a new baseline. However, despite the low shipment volumes, upcoming iterations of Apple’s iPhone and Samsung’s foldables are likely to fare well, prompting a bump in sales volumes in the coming quarters.”
Background
Counterpoint Technology Market Research is a global research firm specializing in products in the TMT (technology, media, and telecom) industry. It services major technology and financial firms with a mix of monthly reports, customized projects, and detailed analyses of the mobile and technology markets. Its key analysts are seasoned experts in the high-tech industry.
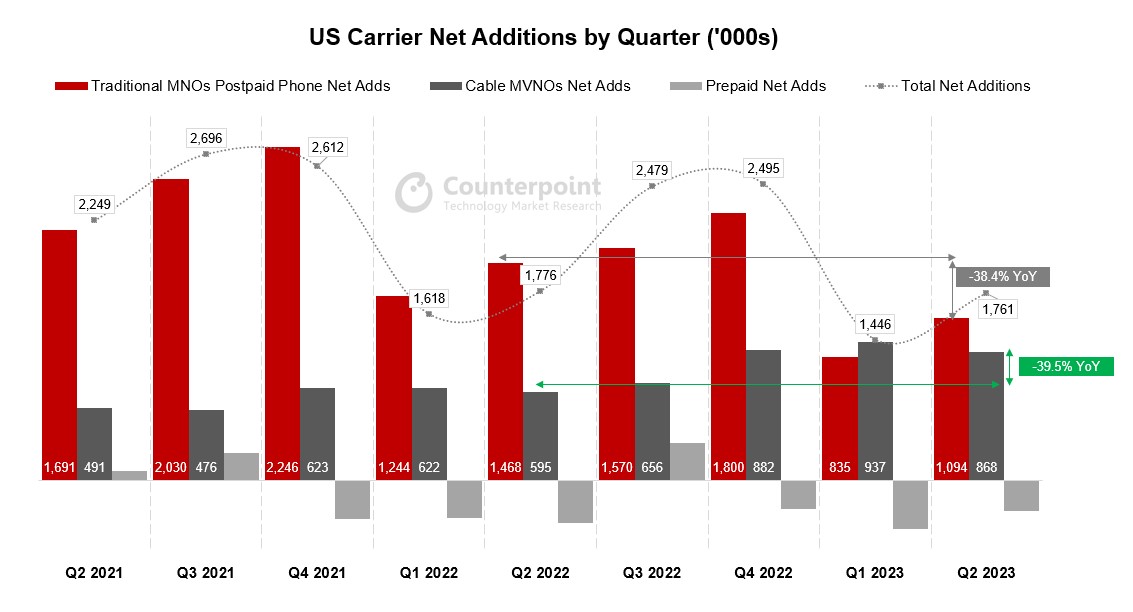
The Q2 2023 earnings season is in the books for the US carriers and several clear trends from the quarter have come into focus. While much of Verizon and AT&T’s earnings calls centered around “lead-sheathed cables”, creating a buzz in the media, the top trends of the quarter for US operators were the ongoing strength of Xfinity and Spectrum Mobile, prepaid to postpaid/cable migration, and record low upgrade rates at the postpaid carriers. Overall phone net additions for Q2 2023 were down slightly YoY with the prepaid market losing value-conscious consumers to Xfinity and Spectrum Mobile, and as Verizon, AT&T and T-Mobile migrated high-value prepaid customers onto their postpaid plans. Additionally, the prepaid market continues to face challenges brought on by recent acquisitions. Meanwhile, existing customers at the postpaid carriers held off on upgrading their devices as overall economic uncertainty resulted in customers holding off on unnecessary upgrades.
*Carrier earnings and Counterpoint Estimates
Cable Players Continue to Win Subscribers
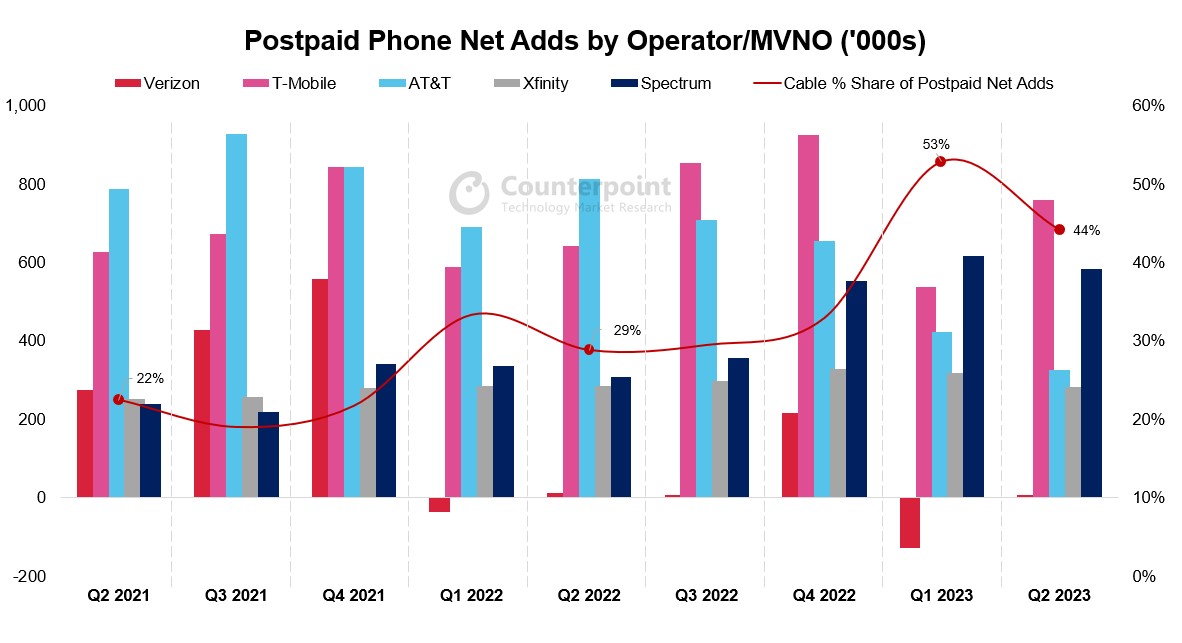
While each of the postpaid carriers posted positive net phone additions in the quarter, their share of net additions was decisively lower than last year. Verizon continues to lag AT&T and T-Mobile by a significant margin in new customer acquisition, but AT&T and T-Mobile are losing steam as the cable players snag a higher share of net additions. In Q1 2023, Xfinity and Spectrum claimed 53% of total net phone additions. In Q2 2023, the figure dropped to 44% but grew significantly from the previous year’s 29% share.
The prepaid segment saw its third consecutive quarter of overall subscriber losses. The segment is seeing value-driven customers opt for competitively priced plans at Xfinity and Spectrum, while the postpaid carriers continue to migrate high-value prepaid customers onto postpaid plans. Verizon continues to see significant subscriber losses as it is still migrating the customers it obtained through the Tracfone acquisition onto its network and off AT&T and T-Mobile’s networks. Verizon has now lost about 1 million of the subscribers it gained from Tracfone. Similarly, Dish continues to see subscriber losses as it struggles to keep the Boost Mobile brand competitive with Metro and Cricket. Dish is also banking on strong performance from its new postpaid Boost Infinite services to keep the brand afloat, although delays in the launch of Boost Infinite and Dish’s slow network buildout have inspired skepticism.
*Carrier earnings and Counterpoint estimates
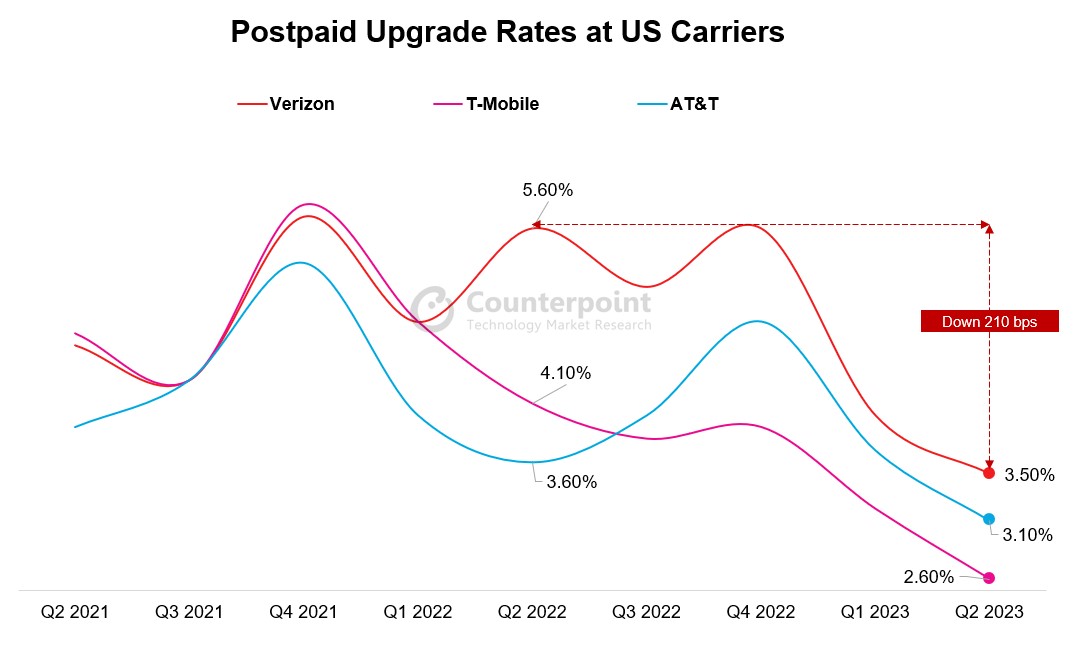
Low Upgrade Rates in Postpaid
Device sales were minimal at the postpaid carriers through Q2 2023 as upgrade rates reached record lows and churn remained minimal. Consequently, equipment revenues were down significantly across the postpaid carriers. As our recent PR noted, smartphone shipments into the US were down 24% YoY, in large part driven by customers holding onto their devices for longer amid economic uncertainty, lower levels of innovation in the smartphone market, and ongoing improvements in device durability. Upgrade rates are likely to remain below last year’s levels through the end of the year and into 2024 constrained by macroeconomic headwinds, but upgrade rates should spike towards the end of Q3 2023 with the launch of the iPhone 15 and through the holiday shopping season in Q4 2023.
*Carrier earnings
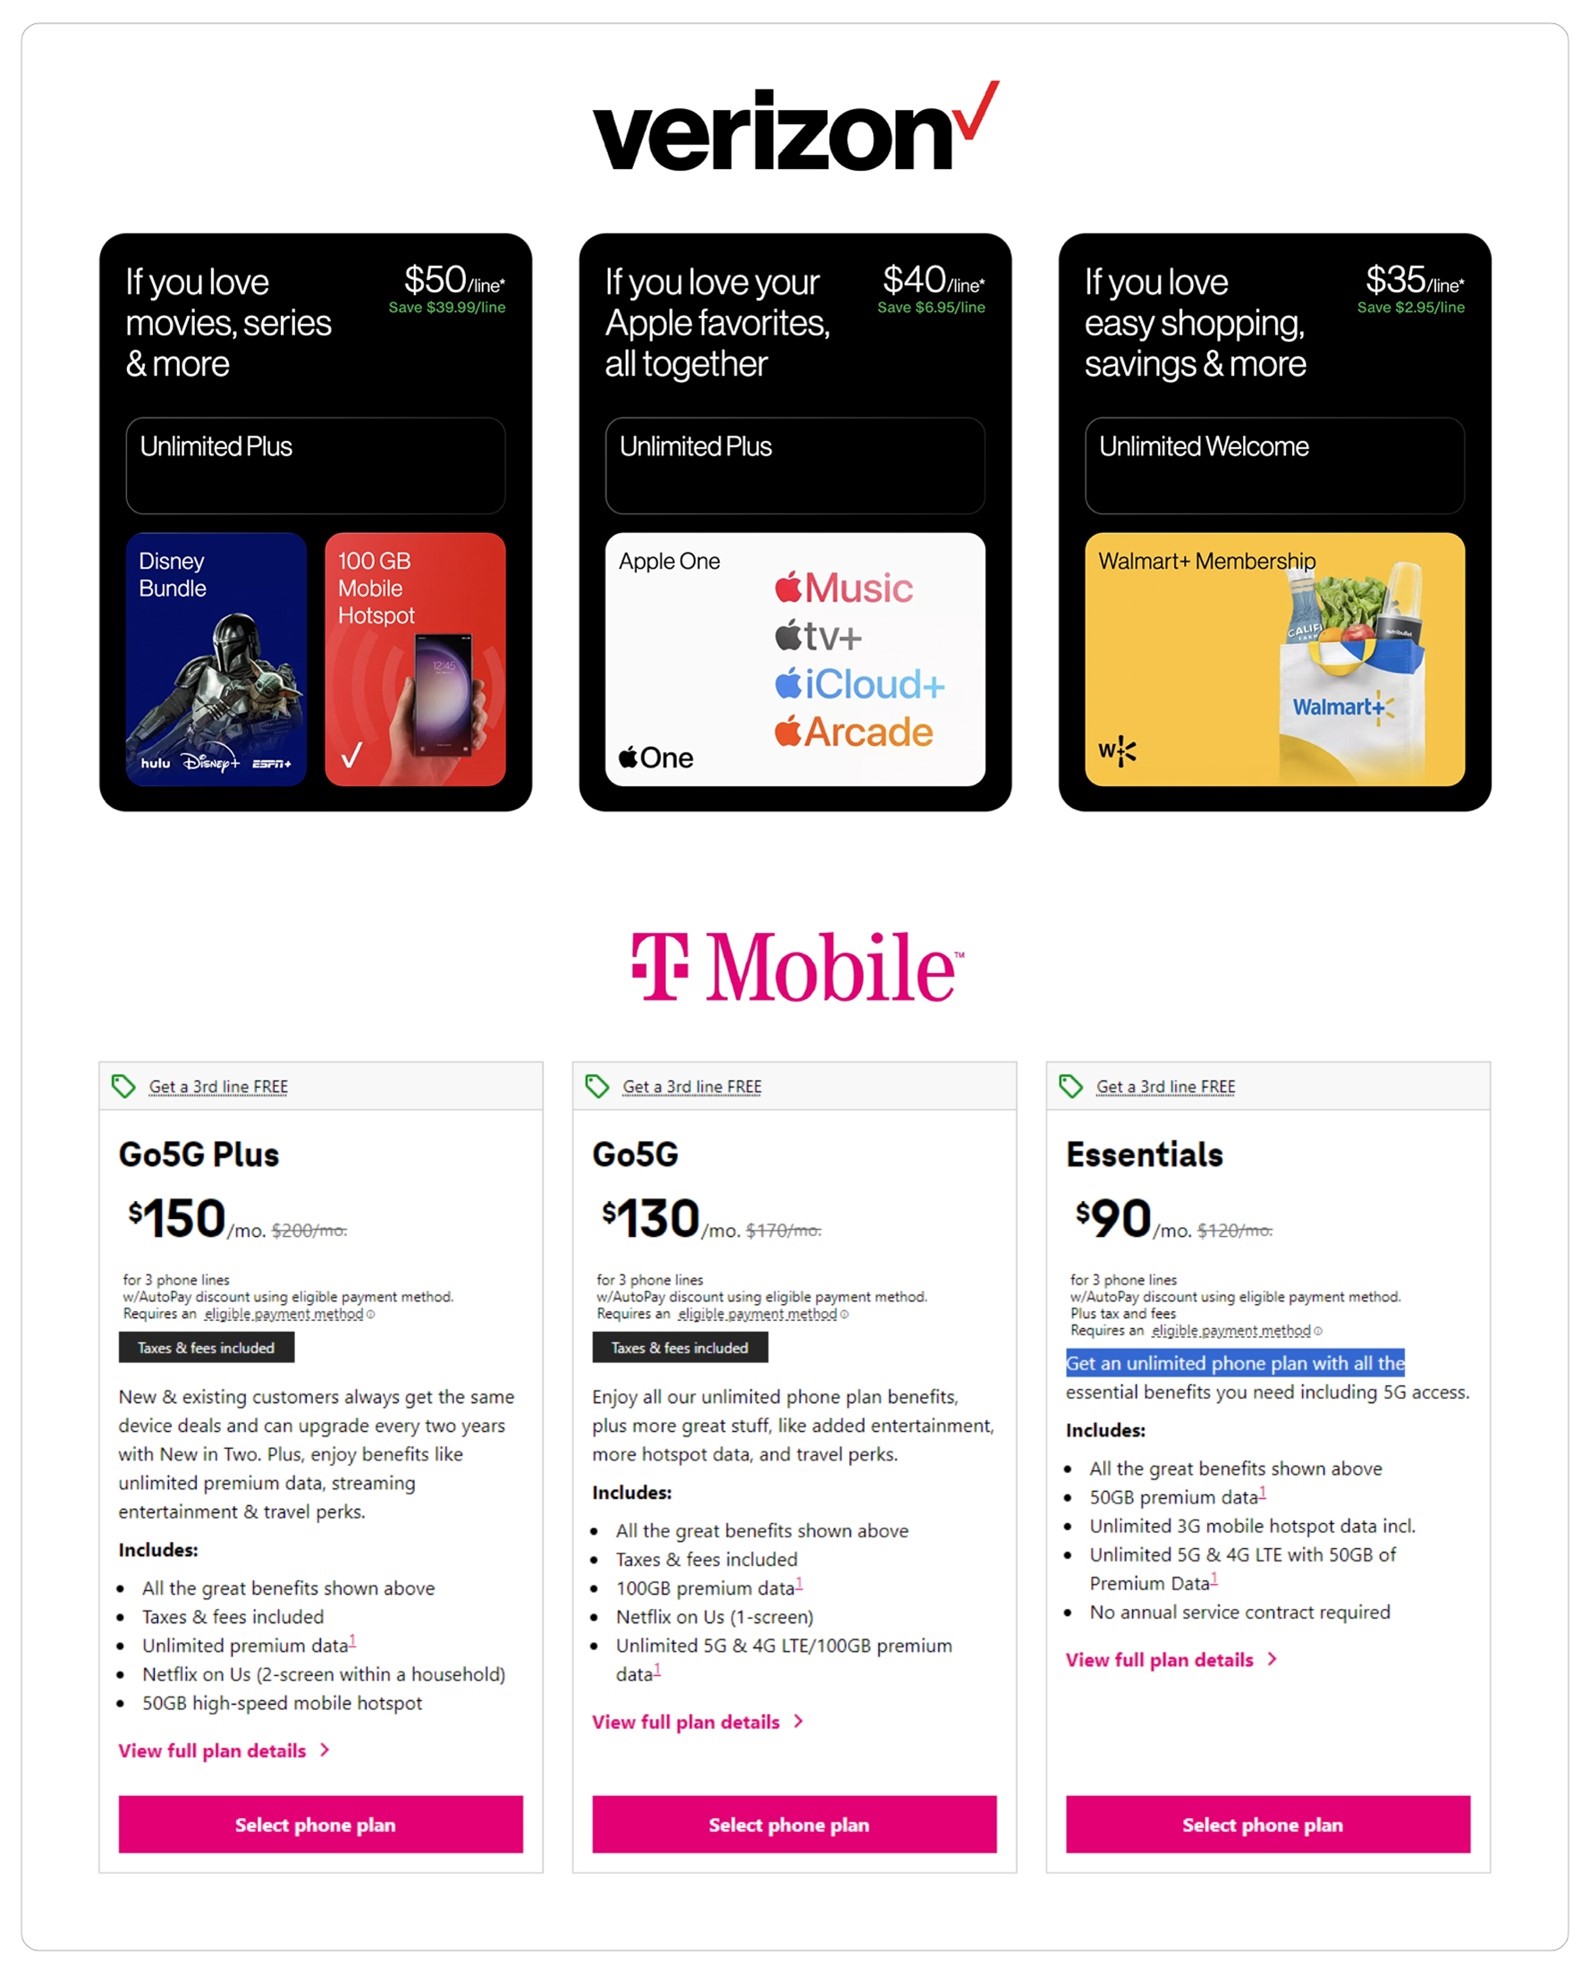
In Q2 2023, the carriers offered strong promotions for upgraders on flagship devices, keeping upgrade rates and device sales from falling further during the quarter. The carriers generally lose money on device sales and make up for it from service revenues. However, as the cable players snare a higher share of customer additions, the growth potential from subscriber growth and consequent service revenues is limited. To combat this situation, the carriers are looking to increase ARPU by offering higher value plans, but also by offering plans on discount to better compete with the cable players. We have also seen AT&T and Verizon increase prices on old plans to raise ARPU or encourage subscribers to adopt new service plans. Verizon and T-Mobile both restructured their service plans during Q2 2023, simplifying their menu of services and improving the value offered to customers. Meanwhile, AT&T stood pat with its slate of service plans but announced that later this year it would reduce its autopay discount to $5/month from $10/month, which will improve ARPU.
*From carrier websites
What to Expect in H2 2023
As 2023 marches on, we expect to see the carriers become even more competitive with their service promotions as the cable players continue to win in customer acquisition. Additionally, we see the carriers offering even more “bundling” opportunities, as they aggregate streaming services, internet service, and cellular service to improve their overall value offer. Meanwhile, prepaid will continue to struggle, as customers in this segment have been the worst hit by inflation. The second half of the year will see an uptick in device sales, as usual, with the launch of the Apple iPhone 15 in September and as the holiday shopping season sets in. However, we expect overall smartphone sales to remain down YoY.
India’s premium smartphone segment now contributes a record 17% to its overall shipments.
With an 18% share, Samsung led India’s smartphone market for the third consecutive quarter.
Samsung also surpassed Apple to become the top premium segment (>INR 30,000 or ~ $366) brand.
Apple continued to lead the ultra-premium segment (>INR 45,000 or ~$549) with a 59% share.
vivo maintained its second position. It was the only brand among the top five to experience YoY growth.
OnePlus was the fastest-growing brand in India’s smartphone market in Q2 with 68% YoY growth.
New Delhi, Hong Kong, Seoul, London, Beijing, San Diego, Buenos Aires – July 28, 2023
India’s smartphone shipments declined 3% YoY in Q2 2023 (April-June), according to the latest research from Counterpoint’sMonthly India Smartphone Tracker. Though this decline was the fourth consecutive quarterly decline, its magnitude reduced significantly, from 19% in Q1 to 3% in Q2. Base effect, pent-up demand and improving macroeconomic conditions helped the market close at less than the expected decline. However, the premium smartphone segment presented a different picture, growing 112% YoY in Q2 to contribute a record 17% to the overall shipments.
Commenting on the market dynamics, Senior Research AnalystShilpi Jain said, “In Q2 2023, OEMs saw improvement in the inventory and demand situation ahead of the coming festive season. Aggressive measures were implemented by OEMs as well as channels during the quarter to clear existing inventory through multiple sales and promotions. At the consumers’ end, falling inflation and better growth prospects facilitated demand recovery. 5G upgrades also played a major role as OEMs kept launching 5G devices in the INR 10,000-INR 15,000 (~$122-$244) segment for a wider reach. We believe brands will be coming up with interesting launches and offers to lure consumers during the festive season and 5G will be a big growth driver here.”
Source: Counterpoint Research Market Monitor
Notes: Xiaomi includes POCO; OPPO excludes OnePlus; vivo includes iQOO; Figures not exact due to rounding
Commenting on the competitive landscape and brand-level analysis, Research Analyst Shubham Singh said, “Samsung remained at the top position for the third consecutive quarter with an 18% market share. The brand also surpassed Apple to regain its top position in the premium smartphone segment (>INR 30,000, ~$366) after one year with a 34% share. Aggressive offers on the Z Flip3 and S21 FE, Samsung Finance+ and high demand for the latest premium A-series and F-series devices drove this growth. However, Apple continued to lead the ultra-premium segment (>INR 45,000 or ~$549) with a 59% share. India is now among Apple’s top-five markets.”
“vivo maintained its second spot in the overall market and was the only brand among the top five to experience YoY growth. Strong offline presence, growth of sub-brand iQOO in online, and multiple launches across price tiers facilitated this growth. OPPO has been consistently expanding its shipments in the higher-tier segments, with a particular focus on the upper mid-tier range (INR 20,000-INR 30,000 or ~$244-$366), showcasing its strategy to cater to diverse consumer needs. OPPO emerged as the top brand in this segment with a 21% market share. OnePlus was the fastest growing brand in India’s smartphone market in Q2 with 68% YoY growth.”
Other key insights
5G smartphone growth: In Q2 2023, 5G smartphone shipments in India crossed the 100-million cumulative mark as 5G upgrades picked up pace driven by the expansion of 5G networks and availability of affordable devices. 5G smartphone shipments grew 59% YoY during the quarter.
Premiumization trend: The premiumization trend gained momentum as the segment grew at a faster rate of 112% YoY. Rise of a value-based incentive system for retailers, aggressive promotions, availability of credit through various financing schemes, and OEMs’ focussed approach are driving premiumization in India.
Channel dynamics: Offline channel share has been growing and is expected to rise to 54% in 2023. Online-heavy brands like Xiaomi, realme and OnePlus are now emphasizing offline expansion to enhance customer engagement and ecosystem development. Samsung and Apple are also increasing their offline presence to cater to diverse consumer preferences. This shift reflects a more comprehensive approach, leveraging both online and offline channels to create a seamless and personalized customer experience.
4G feature phone growth: 4G feature phone share in the overall feature phone shipments increased to 10% in Q2 2023 driven by the JioBharat and itel Guru series’ launch. We believe this share will increase to 18% by the end of 2023. Growing demand for UPI, multiple launches from OEMs and Reliance push will help the segment grow further.
Inventory levels: The market was able to exit Q2 2023 with eight weeks of inventory as Xiaomi and realme managed to clear most of their inventory through multiple sales and promotions.
Other notable brands which grew during Q2 2023 were Apple (56% YoY), Transsion (34%), Lava (53% YoY) and Nokia (6% YoY).
The comprehensive and in-depth ‘Q2 2023 Market Monitor’ is available for subscribing clients.
Feel free to contact us at press@counterpointresearch.com for questions regarding our latest research and insights.
The Market Monitor research relies on sell-in (shipments) estimates based on vendors’ IR results and vendor polling, triangulated with sell-through (sales), supply chain checks and secondary research.
Counterpoint Technology Market Research is a global research firm specializing in products in the TMT (technology, media and telecom) industry. It services major technology and financial firms with a mix of monthly reports, customized projects and detailed analyses of the mobile and technology markets. Its key analysts are seasoned experts in the high-tech industry.
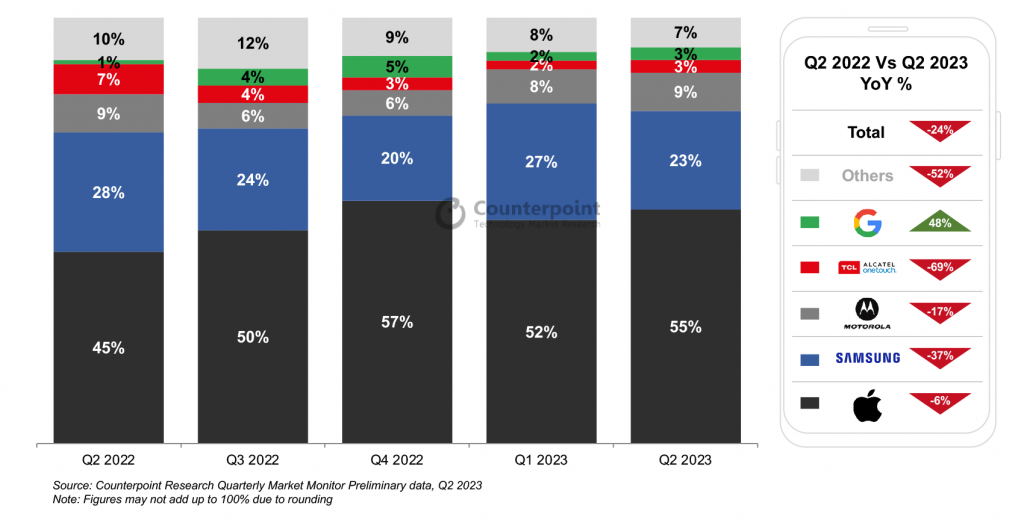
Shipments declined YoY for the third consecutive quarter amid weak consumer demand.
Android smartphone shipments declined 38% while Apple shipments fell 6% YoY.
Consumers hesitated to purchase smartphones amid economic uncertainty.
Google and Motorola launched new foldable models during the quarter.
Low smartphone upgrade rates are likely to persist in Q3 2023.
Denver, Boston, Toronto, London, New Delhi, Hong Kong, Beijing, Taipei, Seoul – July 28, 2023
US smartphone shipments declined 24% YoY in Q2 2023, according to Counterpoint Research’s Market Monitor data. This was the third consecutive quarter of YoY declines. Android brands like Samsung, Motorola and TCL-Alcatel saw the steepest declines in shipments, while Apple’s shipments were more resilient. As a result, Apple’s share of shipments increased YoY.
US Smartphone Shipment Share by OEM
Commenting on the decline in smartphone shipments, Research Analyst Matthew Orf said, “Consumer demand for smartphones was tepid in Q2 2023, with the summer slump in sales coming early. Despite inflation numbers falling through the quarter and ongoing strength in the job market, consumers hesitated to upgrade their devices amid market uncertainty. We expect this trend to continue through Q3 2023, but the expectations from the upcoming iPhone 15 remain bullish.”
Despite the overall drop in shipments, certain segments of the US smartphone market saw important signs of life in the quarter. Senior Research AnalystMaurice Klaehne said, “In spite of declining smartphone shipments, the foldable market reached important milestones in the quarter. Motorola launched the Razr+, its first foldable device in the US since 2021, and Google launched its first-ever foldable, the Pixel Fold, providing alternatives to the Samsung Galaxy foldables. With new Galaxy Z Flip and Z Fold devices coming from Samsung in Q3 2023, foldable shipments could reach their highest level ever in the US in Q3 2023.”
Associate Research Director Hanish Bhatia noted, “Despite fewer shipments from Apple compared to the same quarter last year, the brand’s share of shipments was still up 10% YoY. Apple’s resilience was driven by strong promotions across postpaid and prepaid. Verizon, AT&T and T-Mobile continued to offer $800+ promo credits for the iPhone 14 while old-generation iPhones were also steeply discounted across prepaid. We are seeing no weakness in the overall promotional activity. In fact, we observed new highs for trade-in credit with Verizon offering up to $1,100 for the Pixel Fold. Google’s Pixel also grew from a small base and launched its old-generation Pixel 6a in the prepaid channel for the first time to compete with the iPhone 11. Both devices were heavily subsidized in prepaid channels.”
Director of North America Research Jeff Fieldhack said, “AT&T and T-Mobile reported positive net adds, but Verizon reported negative net adds within its consumer segment for the second consecutive quarter. The net-add activity remains comparable to last year, but the upgrade rates have been lower, causing overall weakness in demand. Near-record low churn has also had a dampening effect on new device sales. Weakness is likely to continue through the start of Q3 2023, but stronger iPhone 15 demand could offset weakness across Android.”
Background
Counterpoint Technology Market Research is a global research firm specializing in products in the technology, media and telecom (TMT) industry. It services major technology and financial firms with a mix of monthly reports, customized projects and detailed analyses of the mobile and technology markets. Its key analysts are seasoned experts in the high-tech industry.
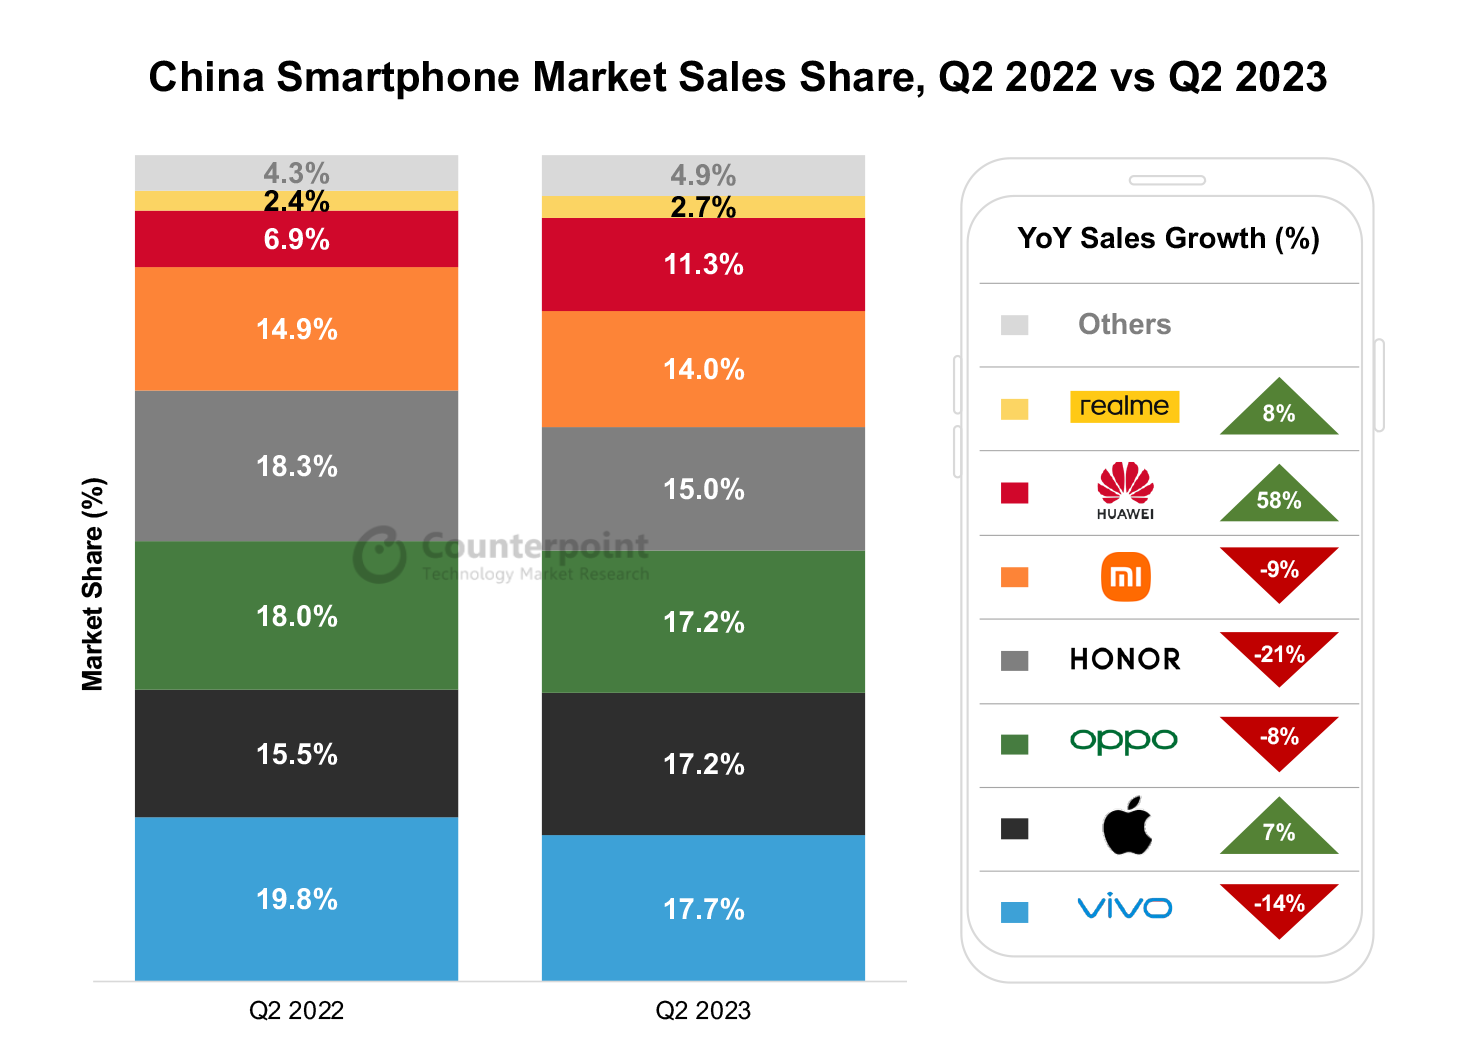
Smartphone sales in China fell 4% YoY in Q2 2023. The sales continued to decline in April and May, while the 618 e-commerce festival provided a boost in June.
Among OEMs, vivo reclaimed its leadership position with a 17.7% market share. OPPO (including OnePlus) and Apple were in a tie in Q2, each capturing 17.2%.
Apple, Huawei and realme managed to achieve positive YoY growth. Huawei’s smartphone sales grew 58% YoY driven by a bigger product portfolio.
Apple’s sales increased 7% YoY as its position in the premium segment remained unchallenged.
Beijing, New Delhi,Hong Kong, London, San Diego, Buenos Aires, Seoul – July 28, 2023
China’s smartphone sales fell 4% YoY in Q2 2023, reaching the lowest Q2 sales figure since 2014, according to Counterpoint’s Market Pulse Service. The macro headwinds, both internal and external, took a toll on Chinese consumer sentiment.
In April and May, smartphone sales remained weak, while the 618 e-commerce festival provided a boost in June, resulting in a 25% MoM growth. However, despite the sequential increase in June, the relatively weak performance observed during the 618 sales period (June 1 to June 18), with an 8% YoY decline according to Counterpoint’s 618 Sales Period Thematic Report, ultimately led to a 6% YoY decline for the full month of June.
Source: Counterpoint Market Pulse Service Notes: OPPO includes OnePlus; Xiaomi includes Redmi; vivo includes iQOO; Figures may not add up to 100% due to rounding
Among OEMs, Apple, Huawei and realme managed to achieve positive YoY growth. Apple maintained excellent sales performance with 7% YoY growth as its position in the premium segment remained unchallenged. The premium segment has proven to be more resilient during economic headwinds. Even within Apple, the sales share of the more premium Pro models grew from around one-third in Q2 2022 to around half in Q2 2023.
Sales of OEMs excluding Apple dropped 5.5% YoY, with all major Android OEMs except Huawei and realme seeing YoY declines. In terms of market share, vivo reclaimed its leadership position with a 17.7% share driven by a strong performance of the Y35 series, Y8 series and the newly launched S17 series. OPPO (including OnePlus) and Apple were in a tie in Q2, each capturing a 17.2% share.
Notably, OnePlus managed to maintain its strong growth momentum from Q1 2023 and achieved YoY growth of 254% in Q2 on the back of channel support from OPPO. On the other hand, OnePlus played an important role in compensating for OPPO’s limited online presence by using its online-centric business model to effectively tap into the segment.
Huawei’s smartphone sales grew 58% YoY in Q2 2023 as the brand managed to resume normal product launches this year. Leveraging its well-established brand image and strong offline footprint, especially in top-tier cities, Huawei witnessed a surge in sales after resolving its product shortages.
HONOR and Xiaomi saw their market shares drop in Q2 2023 on escalating competition. But HONOR has been catching up in offline presence in China.
With a disappointing performance in H1 2023, we have revised downwards our 2023 forecast for China’s smartphone market – from flat growth to a low single-digit YoY decrease. While we anticipate an improvement in smartphone sales during H2 when compared to H1, a strong rebound does not seem to be on the horizon as challenges that affected the performance in H1 are likely to persist.
Background
Counterpoint Technology Market Research is a global research firm specializing in products in the TMT (technology, media, and telecom) industry. It services major technology and financial firms with a mix of monthly reports, customized projects, and detailed analyses of the mobile and technology markets. Its key analysts are seasoned experts in the high-tech industry.
In order to access
Counterpoint Technology Market Research Limited (Company or We hereafter) Web sites, you may be asked to complete a registration form. You are required to provide contact information which is used to enhance the user experience and determine whether you are a paid subscriber or not.
Personal Information
When you register on we ask you for personal information. We use this information to provide you with the best advice and highest-quality service as well as with offers that we think are relevant to you. We may also contact you regarding a Web site problem or other customer service-related issues. We do not sell, share or rent personal information about you collected on Company Web sites.
How to unsubscribe and Termination
You may request to terminate your account or unsubscribe to any email subscriptions or mailing lists at any time.
In accessing and using this Website, User agrees to comply with all applicable laws and agrees not to take any action that would compromise the security or viability of this Website. The Company may terminate User’s access to this Website at any time for any reason. The terms hereunder regarding Accuracy of Information and Third Party Rights shall survive termination.
Website Content and Copyright
This Website is the property of Counterpoint and is protected by international copyright law and conventions. We grant users the right to access and use the Website, so long as such use is for internal information purposes, and User does not alter, copy, disseminate, redistribute or republish any content or feature of this Website. User acknowledges that access to and use of this Website is subject to these TERMS OF USE and any expanded access or use must be approved in writing by the Company.
– Passwords are for user’s individual use
– Passwords may not be shared with others
– Users may not store documents in shared folders.
– Users may not redistribute documents to non-users unless otherwise stated in their contract terms.
Changes or Updates to the Website
The Company reserves the right to change, update or discontinue any aspect of this Website at any time without notice. Your continued use of the Website after any such change constitutes your agreement to these TERMS OF USE, as modified.
Accuracy of Information:
While the information contained on this Website has been obtained from sources believed to be reliable, We disclaims all warranties as to the accuracy, completeness or adequacy of such information. User assumes sole responsibility for the use it makes of this Website to achieve his/her intended results.
Third Party Links:
This Website may contain links to other third party websites, which are provided as additional resources for the convenience of Users. We do not endorse, sponsor or accept any responsibility for these third party websites, User agrees to direct any concerns relating to these third party websites to the relevant website administrator.
Cookies and Tracking
We may monitor how you use our Web sites. It is used solely for purposes of enabling us to provide you with a personalized Web site experience.
This data may also be used in the aggregate, to identify appropriate product offerings and subscription plans. Cookies may be set in order to identify you and determine your access privileges. Cookies are simply identifiers. You have the ability to delete cookie files from your hard disk drive.