Top

Average Smartphone NAND Flash Capacity Crossed 100GB in 2020

NAND flash capacity has emerged as one of the most important considerations for consumers while purchasing a new smartphone. The advancements in cameras, Application Processors (APs) and displays have stimulated increased storage demand for videos, images and other multimedia applications. Consequently, NAND capacity has shown significant growth in smartphones.

According to Counterpoint’s latest report on smartphone memory, the average smartphone NAND flash capacity crossed the 100GB mark in 2020 for the first time. However, it differs in iOS and Android phones. In iOS phones, the average NAND capacity reached 140.9GB in Q4 2020, compared to 95.7GB in Android phones during the same period. But this gap is narrowing. It is evident from the graph below that the average capacity of Android has been increasing rapidly in the past few years. The average capacity in 2020 grew 5.6% and 20.5% for iOS and Android phones, respectively.

Exhibit 1: Global Average Smartphone NAND Flash Capacity by iOS and Android
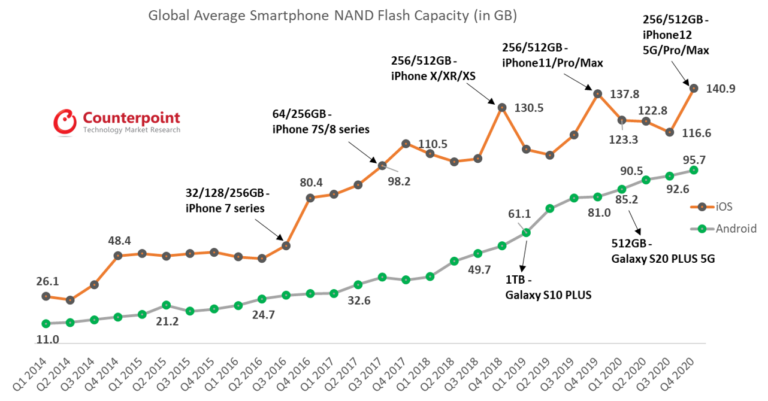
Counterpoint Research Global Average Smartphone NAND Flash Capacity by iOS and Android

The data indicates that Apple did not push the boundaries of its storage size and chose to stick to 512GB NAND, its highest storage capacity which has been there since 2018. On the other hand, the biggest Android OEM, Samsung, looked to maximize its storage capacity and launched the Samsung Galaxy S10 Plus in 2019 with 1TB NAND. All this resulted in a lower storage growth rate for iOS compared to Android in 2020.

According to our Q1 2019-Q4 2020 mobile handset sell-through tracker, NAND flash in smartphones grew by 20.3% on average, from 80.7GB in 2019 to 97.11GB in 2020. However, iOS saw a 5.6% increase in 2020, much lower than the 20.5% growth in non-iOS devices. The difference in average capacity between iOS and non-iOS devices continues to decrease. The gap between the two groups was approximately 45.2GB in Q4 2020, down from 56.8GB in Q4 2019.

Although NAND price continued to fall during 2019-2020, the share of sales of high-capacity models (256GB and 512GB) for iOS did not grow during the same period. The share of high capacity in Q4 2020 was about 21.5%, even lower than the 27.2% in Q4 2019. The average capacity of iOS has reached nearly 130GB. 128-256GB is high enough for the average consumer to use during the iPhone usage cycle. The demand for 512GB iPhone was around 3.7% in Q4 2020.

We also observe a similar situation for high capacity (256GB+512GB+1,024GB) in non-iOS smartphones. The proportion of high capacity was around 7.5% in Q4 2020, only slightly higher than the 6.3% in Q4 2019. However, the proportion of 128GB for non-iOS smartphones increased from 26.2% in Q4 2019 to 39.0% in Q4 2020, showing that 128GB was the minimum standard for mid-range and high-end phones.


For the details, please check the report on our website.

Smartphones Memory Historical data and Forecast, Worldwide Demand, 2018-2024

Overview:

This forecast provides detailed statistical data for DRAM and NAND flash for smartphones by density, segment and network in the short and long terms.

Table of Contents:

  • Historical NAND Flash Units Sell-through by Smartphone Segment (Q1 2019 – Q4 2020)
  • Historical NAND Flash Units Sell-through by Smartphone Network (5G, 4G, Others)
  • Historical NAND Flash Units Sell-through by Smartphone Density
  • Historical NAND Flash Units Sell-through by Smartphone Density
  • Forecast Memory Units Shipment in Annual Base (2018-2024)
  • Charts
  • Global average smartphone NAND flash capacity trends (GBs), 2014-2020

Author: Brady Wang
Number of Pages: 33
Published Date: March 2021

Related Posts

The NAND flash consumption of mobile devices will be three times larger in 2025 than 2021, with the coming of the 5G era

Sponsored by Western Digital, Counterpoint has published a white paper that investigates storage demands for different 5G mobile applications. The white paper aims to increase awareness among mobile device manufacturers about the different needs for storage in 5G-driven applications, and clarify the characteristics and differences of various storage types.

5G adds complexity as each mobile device to both generate, as well as consume, several times more data than current devices. Higher 5G throughputs will drive richer content streaming. More advanced AI applications will add further complexity to the choice of storage. Considering storage early in the design phase will help to improve the performance of 5G mobile devices and will potentially be a point of differentiation among competing products.

The key trends for storage in 5G-capable mobile devices:

  • Better performance in sequential reading/writing speed and bandwidth
  • Larger capacity to 256GB, 512GB, and above
  • Lower costs including 3D NAND, TLC, QLC
  • Better controller qualities in architecture, lifetime, wear leveling, over-provisioning
  • Embedded Storage Interfaces including UFS 2.1, UFS 3.x, UFS4.x, and PCIe
  • Better reliability to improve the lifetime of the device

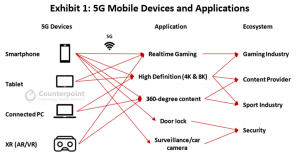
The key mobile devices to be driven by 5G include smartphones, connected PCs, tablets, and standalone eXtended Reality (XR) head-mounted-displays (HMD). All these devices will have different requirements for storage. Many of these devices will also drive new use cases, potentially generating more service revenue as outlined in the diagram:  

Opportunity for storage players

eMMC 5.1 can still meet the demand for some devices migrating initially from 4G to 5G. However, The UFS interface aligns best with most 5G devices because of its high Gbps-level throughputs. Connected PCs will need both UFS storage and PCIe SSDs, while others will prefer UFS as the main storage interface.

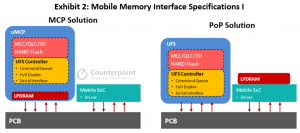
From the perspective of the package, MCP solutions are dominant only in the low to mid-range smartphones. While system designers for high-performance mobile devices prefer to use package-on-package (PoP) solution which includes low power DRAM plus discrete UFS or eMMC. PoP solutions can provide better performance than MCP solutions because the application processor (AP) can directly communicate with low power DRAM at high frequencies to reduce the interference of AP and RAM communication signals. 

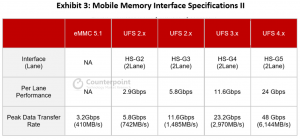
From the perspective of performance, eMMC has become the mainstream of mobile application data storage for several years. However, the speed of eMMC is reaching a limit because of its parallel 8-bit transmission. As a result, UFS is poised to become the mainstream interface in the 5G era because its serial interface and full-duplex data transfer protocol can offer two to four times the peak bandwidth of eMMC’s parallel 8-bit interface. UFS 2.x and UFS 3.x can reach a maximum speed of 11.6Gbps (1450 MB/s) and 23.2Gbps (2,900 MB/s), respectively. Both are much higher than eMMC 5.1’s 3.2Gbps (400 MB/s). Future UFS 4.x can be even faster.

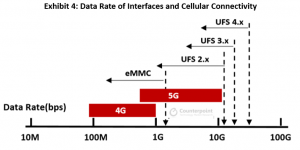
The UFS interface aligns well with the higher Gbps level throughputs promised in 5G, compared to eMMC which could be a bottleneck for some 5G-driven mobile devices such as connected PCs, XR devices, smartphones, and tablets. Further, the power consumption of UFS in standby mode is like that of eMMC. In the active mode, UFS power consumption is higher than eMMC but UFS can rapidly transmit more data, allowing a return to an idle state faster. So, UFS is significantly lower compared to eMMC in terms of overall power consumption and can enable battery savings for battery-powered IoT applications. Further, UFS also delivers greater overall system performance and user experiences, which makes it the choice of memory storage interface for 5G mobile devices.

Compared to 5G’s 1-10 Gbps, the theoretical transmission rate of 4G LTE can exceed 1Gbps, but the actual speeds in most cases are still below 500Mbps. 5G-powered XR, online game, and 8K video will require speeds of 6 Gbps, so UFS is essential in these applications.

Conclusion & Recommendations

  • UFS is the most suitable interface for 5G-driven mobile devices. Its fast speed and responsiveness can meet the requirements of instant-on, fast-booting, multitasking, and multiprocessing in the 5G era. Also, it consumes less power so it can extend battery life.
  • Mobile game streaming will grow strongly with 5G’s large bandwidth and low latency. Content providers need to know the capability, requirements, and limitations of 5G and design high-quality mobile games with cloud streaming on any device.
  • The price of NAND flash is declining. However, 5G-centric devices will require high-performance storage solutions. Mobile devices manufacturers must understand the characteristics of different types of flash to choose the appropriate memory to meet the performance requirements of their applications.
  • To be successful in the 5G era, flash makers must understand the demand and the impact of these 5G devices on storage and realize the market potential for various applications to provide the right solutions


Download the Whitepaper: The NAND flash consumption of mobile devices will see three times larger in 2025 than 2021, with the coming of the 5G era. (for free)

SK Hynix to Cut DRAM Production and Reduce Wafer Start of NAND Flash

SK Hynix will begin to cut DRAM production from Q4 2019 as well as reduce its NAND flash wafer start by 15% as compared to its 2018 output. Last quarter, the company had said it would reduce NAND flash wafer starts by 10%.

The fresh set of announcements come after the company reported an 89% year-on-year (YoY) decline in operating profit in Q2 2019. This was despite a 13% quarter-on-quarter (QoQ) increase in DRAM bit shipments, mainly due to the growing demand from the mobile and PC DRAM markets. However, DRAM prices are still weak. In fact, average selling prices (ASPs) have dropped by 24%. It was a similar story in the NAND flash market where the company’s shipments increased 40%, but ASPs were down 25%.

Exhibit 1: SK Hynix DRAM bit shipment and Blended ASP from 1Q18 to 2Q19

Source: Counterpoint Research – Memory Tracker and Forecast

Usually, both DRAM and NAND flash have the characteristics of a boom-bust cycle. As a result, these two products normally do not reach the bottom at the same time. Therefore, the production capacity is interchangeable to can make up for each other’s losses. However, this time, the situation is very different. Both DRAM and NAND flash are at the bottom of their bust cycle, which is hurting Samsung, SK Hynix, and Micron. It is still unclear how long the threat of the trade war between Japan and South Korea will last. In order to reduce the risk of raw material shortage as well as limited resources for investment, SK Hynix must choose between a cut in spending on DRAM or NAND flash.

Currently, spot prices of both DRAM and NAND flash have rebounded. However, contract pricing has not seen a significant rebound because of high inventory in the channels. Therefore, SK Hynix’s DRAM investment cuts can increase its bargaining power. However, this takes time and has risks since other competitors take this chance to grasp more share from SK Hynix. The two main applications of DRAM are smartphones and servers. The growth of both smartphones shipment and DRAM content will be limited while the server market is still in a downturn. Therefore, we expect that DRAM prices will rise marginally in the short-term but will continue to be weak afterward.

The situation for NAND flash is different. The demand for NAND flash in smartphones is still growing. The average storage size in smartphones in 2020 is expected to reach 72GB, up from 64GB in 2019. The storage size of the flagship smartphone will be at least 128GB in the H2 2019. In addition, the demand for NAND flash in SSDs is also growing. Both PCs and servers require larger and faster NAND flash. The mainstream capacity of SSD in PC is moving to 512GB from 256GB. The average capacity has also risen to 321GB. As the unit price of NAND flash declines, the penetration rate of SSD in both PC and server will also increase significantly. Therefore, we expect to see the penetration of SSDs in PCs continuing to rise and cross the 50% mark this year. The NAND flash market is expected to recover in Q4. Demand will increase as prices decline. As a result, it can help companies like SK Hynix increase the bit growth and improve the utilization rate of their production lines.

In conclusion, it makes sense for SK Hynix to cut DRAM investment. In the case of limited resources in raw material and CAPEX, the bit growth of DRAM will be lower than that of NAND flash. SK Hynix should immediately stop producing 36 and 48 layer products as they are not economically viable. Instead, the company can do better by focussing on improving the yields, increase the capacity of NAND flash, its 96 layer products, and even 128 layer NAND flash. This can increase utilization and effectively reduce costs.

Another Set of Tariffs on Chinese Imports to the US will Further Slowdown Recovery of NAND Flash Market

The US is likely to impose high tariffs on all remaining Chinese imports, including all handsets manufactured or assembled in China. The tariffs, estimated to be as high as roughly US$325 billion, could delay the recovery of the NAND flash market.

In 2018, the global NAND flash market reached US$58 billion. Mobile phones account for 42.1% of the total market, the largest among all NAND flash applications. According to our research, Samsung, Apple, and Huawei captured more than 40% of the smartphone market in 2018, with a share of 19.5%, 13.7%, and 13.7%, respectively. Considering the average capacity of each OEM, Apple’s NAND bit consumption stood at 28.4%, much higher than Samsung at 15.4%, and Huawei’s 10.8%.

Table 1: Average Storage Capacity by Vendors, 2018

Smartphone Vendors (2018) Samsung Apple Huawei Total
Unit Share(%) 19.5% 13.7% 13.7% 100.0%
Average Capacity(GB)                             42.9                          115.1                         69.0                             54.8
NAND consumption % 15.4% 28.4% 15.8% 100.0%

Source: Counterpoint Research – Global Smartphone Memory Capacity Tracker, June 2019

More than 95% of Apple phones get assembled in China. The additional cost of the new tariffs will increase the unit price of Apple’s smartphones in the US. As a result, to offset the increasing prices, Apple needs to reduce the bill of materials (BOM) cost. Samsung faces the same situation. However, to compete with other manufacturers in specifications and functions, it is still necessary to keep some features, such as AMOLED display, multi-camera, 3D Sensing authentication, high-performance Application Processor, and more. As a result, one of the options to reduce the price is to allow consumers to change the capacity of NAND storage freely.

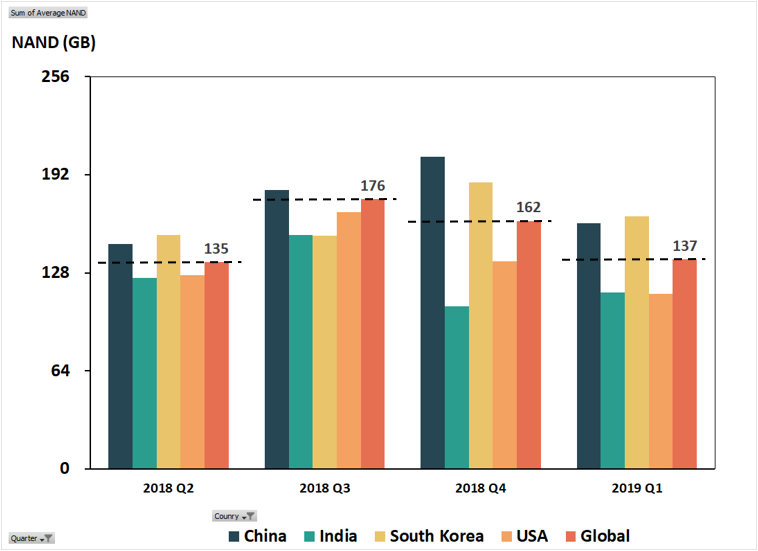
Therefore, consumers in the US may choose a lower-capacity or an entry-level iPhone. Lower NAND capacity may cause some inconvenience but is still acceptable. At present, the capacity of iPhones around the world roughly ranges from 85GB to 183GB. The average capacity iPhone X, XR, and XS, in the US, is about 114.3GB, which is slightly lower than the average – 137GB in 1Q19. However, to reduce the impact of increasing tariffs, the growth of storage capacity of iPhones sold in the US is expected to be flat or even declining marginally.

Figure 1: Average Storage Capacity of iPhone X, XR, XS by Country

Source: Counterpoint Research, June 2019

During Q1 2019, the demand for NAND flash remained sluggish as server and smartphone demand has been weak. On the other hand, customers are still struggling to reduce their inventory from 2018. They are also preparing to evaluate the new 90-layer 3D NAND as well as QLC chips. The recovery of smartphones in H2 2019 is expected to generate demand, and the decreasing price will lead to capacity increases. If this happens, inventory could have returned to normal levels by the end of 2019.

However, the added cost of tariff will slow down the demand and offset the memory capacity increase due to decreasing prices. Therefore, the situation of oversupply is expected to continue till 2020 and recover by H1 2021. This may be not good news for NAND new makers – YMTC because decreasing prices will be negative to the sales of low-end products.

Average Smartphone NAND Storage Capacity will Top 60GB by 2018

Flash Memory storage has become an important component in smartphones not only for consumers as their needs for storage keeps on increasing with content creation, consumption but also for OEMs from BoM costs perspective and suppliers looking to meet this ever-growing demand from smartphones to cloud data centers. We have been researching in detail about the NAND storage technologies (See here) as well as DRAM (see here) trends and would like to highlight some latest demand trends and how can suppliers meet this ever growing demand from technology perspective.

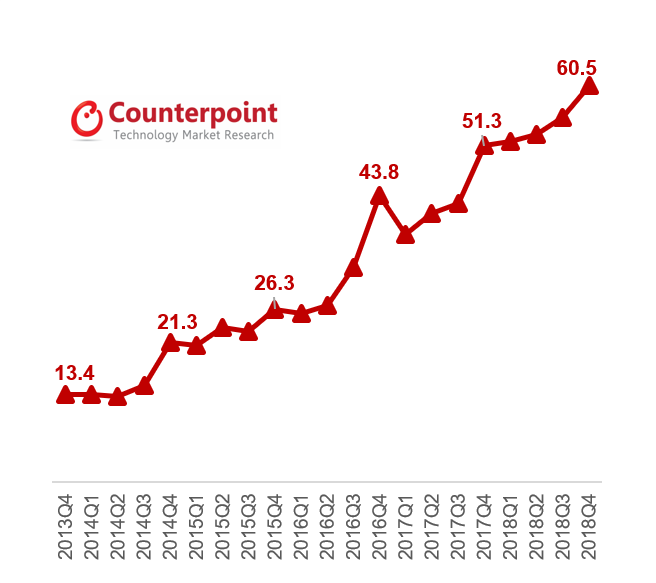
The NAND Flash demand has been growing almost exponentially, much of which is attributed to the growth of the avg. capacity in smartphones. The average capacity in smartphones is estimated to cross 50GB per smartphone this year and estimated to cross 60GB mark per smartphone in Q4 2018.

Exhibit : Global Average Smartphone NAND Flash Capacity Trend (GB)

In contrast, industry has been facing supply crunch as the 2D NAND output is no longer sufficient to cater to current and future rise in demand for smartphones as well as SSD demand in personal computing devices. To meet the growing demand and increase NAND bit outputs, the storage memory suppliers are transitioning from 2D NAND to 3D NAND technology & manufacturing, a necessary technology transition. However, slower than expected ramp from various players has hurt supply positions in the short – midterm.

As a result, over the last eighteen months the NAND memory prices have risen in the range of 15% to 40% depending on the memory type and density. While the move to 64L 3D NAND (from 2D NAND or 32L/48L MLC 3D NAND) will ease supply a bit, the transition to and adoption of higher density TLC 3D NAND will be the key to ensure healthy supply & business continuity in the future.

The detailed whitepaper on this topic is available for download here

Term of Use and Privacy Policy

Counterpoint Technology Market Research Limited

Registration

In order to access Counterpoint Technology Market Research Limited (Company or We hereafter) Web sites, you may be asked to complete a registration form. You are required to provide contact information which is used to enhance the user experience and determine whether you are a paid subscriber or not.
Personal Information When you register on we ask you for personal information. We use this information to provide you with the best advice and highest-quality service as well as with offers that we think are relevant to you. We may also contact you regarding a Web site problem or other customer service-related issues. We do not sell, share or rent personal information about you collected on Company Web sites.

How to unsubscribe and Termination

You may request to terminate your account or unsubscribe to any email subscriptions or mailing lists at any time. In accessing and using this Website, User agrees to comply with all applicable laws and agrees not to take any action that would compromise the security or viability of this Website. The Company may terminate User’s access to this Website at any time for any reason. The terms hereunder regarding Accuracy of Information and Third Party Rights shall survive termination.

Website Content and Copyright

This Website is the property of Counterpoint and is protected by international copyright law and conventions. We grant users the right to access and use the Website, so long as such use is for internal information purposes, and User does not alter, copy, disseminate, redistribute or republish any content or feature of this Website. User acknowledges that access to and use of this Website is subject to these TERMS OF USE and any expanded access or use must be approved in writing by the Company.
– Passwords are for user’s individual use
– Passwords may not be shared with others
– Users may not store documents in shared folders.
– Users may not redistribute documents to non-users unless otherwise stated in their contract terms.

Changes or Updates to the Website

The Company reserves the right to change, update or discontinue any aspect of this Website at any time without notice. Your continued use of the Website after any such change constitutes your agreement to these TERMS OF USE, as modified.
Accuracy of Information: While the information contained on this Website has been obtained from sources believed to be reliable, We disclaims all warranties as to the accuracy, completeness or adequacy of such information. User assumes sole responsibility for the use it makes of this Website to achieve his/her intended results.

Third Party Links: This Website may contain links to other third party websites, which are provided as additional resources for the convenience of Users. We do not endorse, sponsor or accept any responsibility for these third party websites, User agrees to direct any concerns relating to these third party websites to the relevant website administrator.

Cookies and Tracking

We may monitor how you use our Web sites. It is used solely for purposes of enabling us to provide you with a personalized Web site experience.
This data may also be used in the aggregate, to identify appropriate product offerings and subscription plans.
Cookies may be set in order to identify you and determine your access privileges. Cookies are simply identifiers. You have the ability to delete cookie files from your hard disk drive.