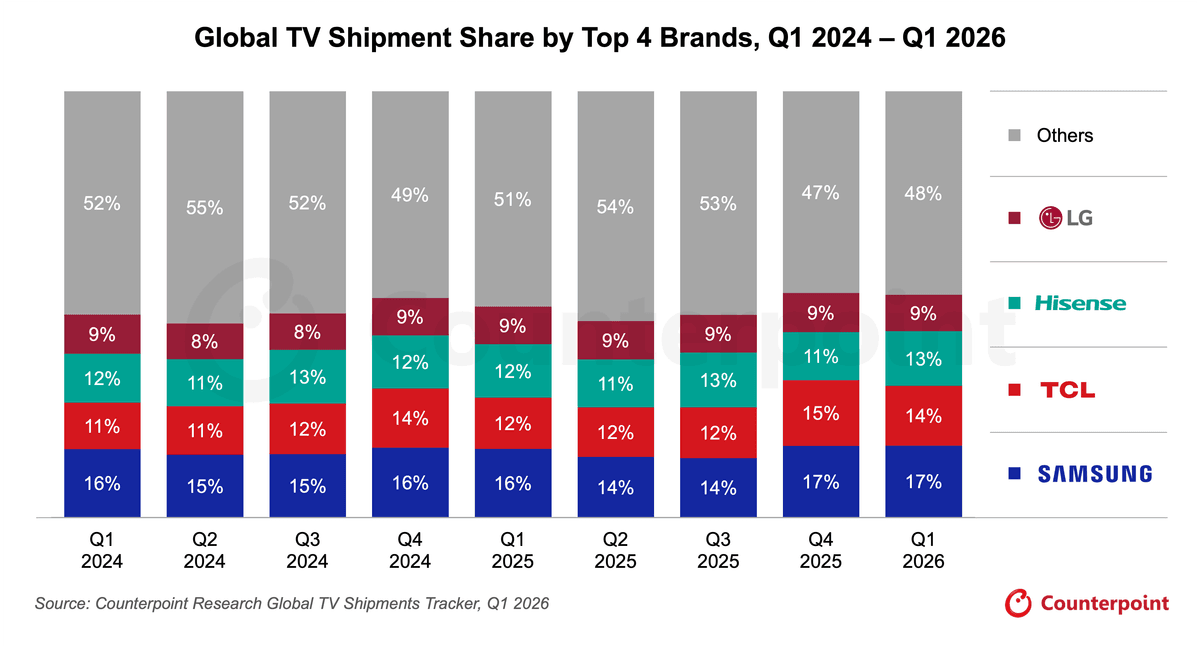
| Brands | Q1 2024 | Q2 2024 | Q3 2024 | Q4 2024 | Q1 2025 | Q2 2025 | Q3 2025 | Q4 2025 | Q1 2026 |
|---|---|---|---|---|---|---|---|---|---|
| Samsung | 16% | 15% | 15% | 16% | 16% | 14% | 14% | 17% | 17% |
| TCL | 11% | 11% | 12% | 14% | 12% | 12% | 12% | 15% | 14% |
| Hisense | 12% | 11% | 13% | 12% | 12% | 11% | 13% | 11% | 13% |
| LG | 9% | 8% | 8% | 9% | 9% | 9% | 9% | 9% | 9% |
| Others | 52% | 55% | 52% | 49% | 51% | 54% | 53% | 47% | 48% |
Market Highlights
- In Q1 2026, Samsung retained its market leadership with a 17% share of global TV shipments.
- TCL's share reached 14% in the first quarter, its seasonally weaker period, narrowing the gap with Samsung from around 4 percentage points in Q1 2025 to roughly 2.8 percentage points in Q1 2026.
- With multiple brands rolling out new RGB MiniLED and MiniLED lineups from late Q1 2026, H1 2026 is set to be a fiercely contested period in the global TV market.
We also have a detailed Global TV shipments tracker available for subscribing clients:
Global TV Shipments Tracker, Q1 2026
This Excel report provides Quarterly global TV shipments, ASP, Revenue along with regional split by brand, size and resolution. This includes the display tech split among 8K LCD, MiniLED LCD, QD LCD, Standard LCD, Micro LED, QD-OLED and White OLED, helping understand the technological shift in TV displays.


