LCD TV Panel Price Stability Combines with Trump Tariffs to Reshape TV Inflation in US
President Trump’s tariffs have altered the TV supply chain and, combined with the long stretch of relatively stable LCD TV panel prices, have also altered the inflation pattern for TVs in the US. The US Bureau of Labor Statistics’ (BLS’) Consumer Price Index (CPI) report for January, released earlier this month, suggests that while overall inflation is cooling, prices for TVs are declining at a slower rate than expected.
The BLS publishes CPI statistics for hundreds of categories, and its current data set goes back to 1996, but the CPI is indexed to 1982-1984. The CPI includes more than 300 sub-indices, each with a weighting that indicates the importance of the sub-index to the overall economy. For example, food items comprise 14% of the CPI and gasoline is weighted at 4%. Televisions have a tiny weighting of only 0.096%.
The January 2026 overall CPI stood at 325.252, which means that a standard basket of goods that could be purchased for $100 in 1982-1984 would cost $325.25 for a consumer today. The CPI for TVs in January 2026 was 0.975, which means that a (hypothetical) TV that cost $100 in 1982-1984 would cost 97.5 cents today.The Global TV Shipments Monthly Tracker provides detailed data on TV shipments for 24 brands across 8 geographic regions, with pivot tables allowing analysis by brand family and display technology (LCD and OLED). The monthly report is issued 45 days after the end of each month.
YoY % Change in US Consumer Price Index, 2011-2026
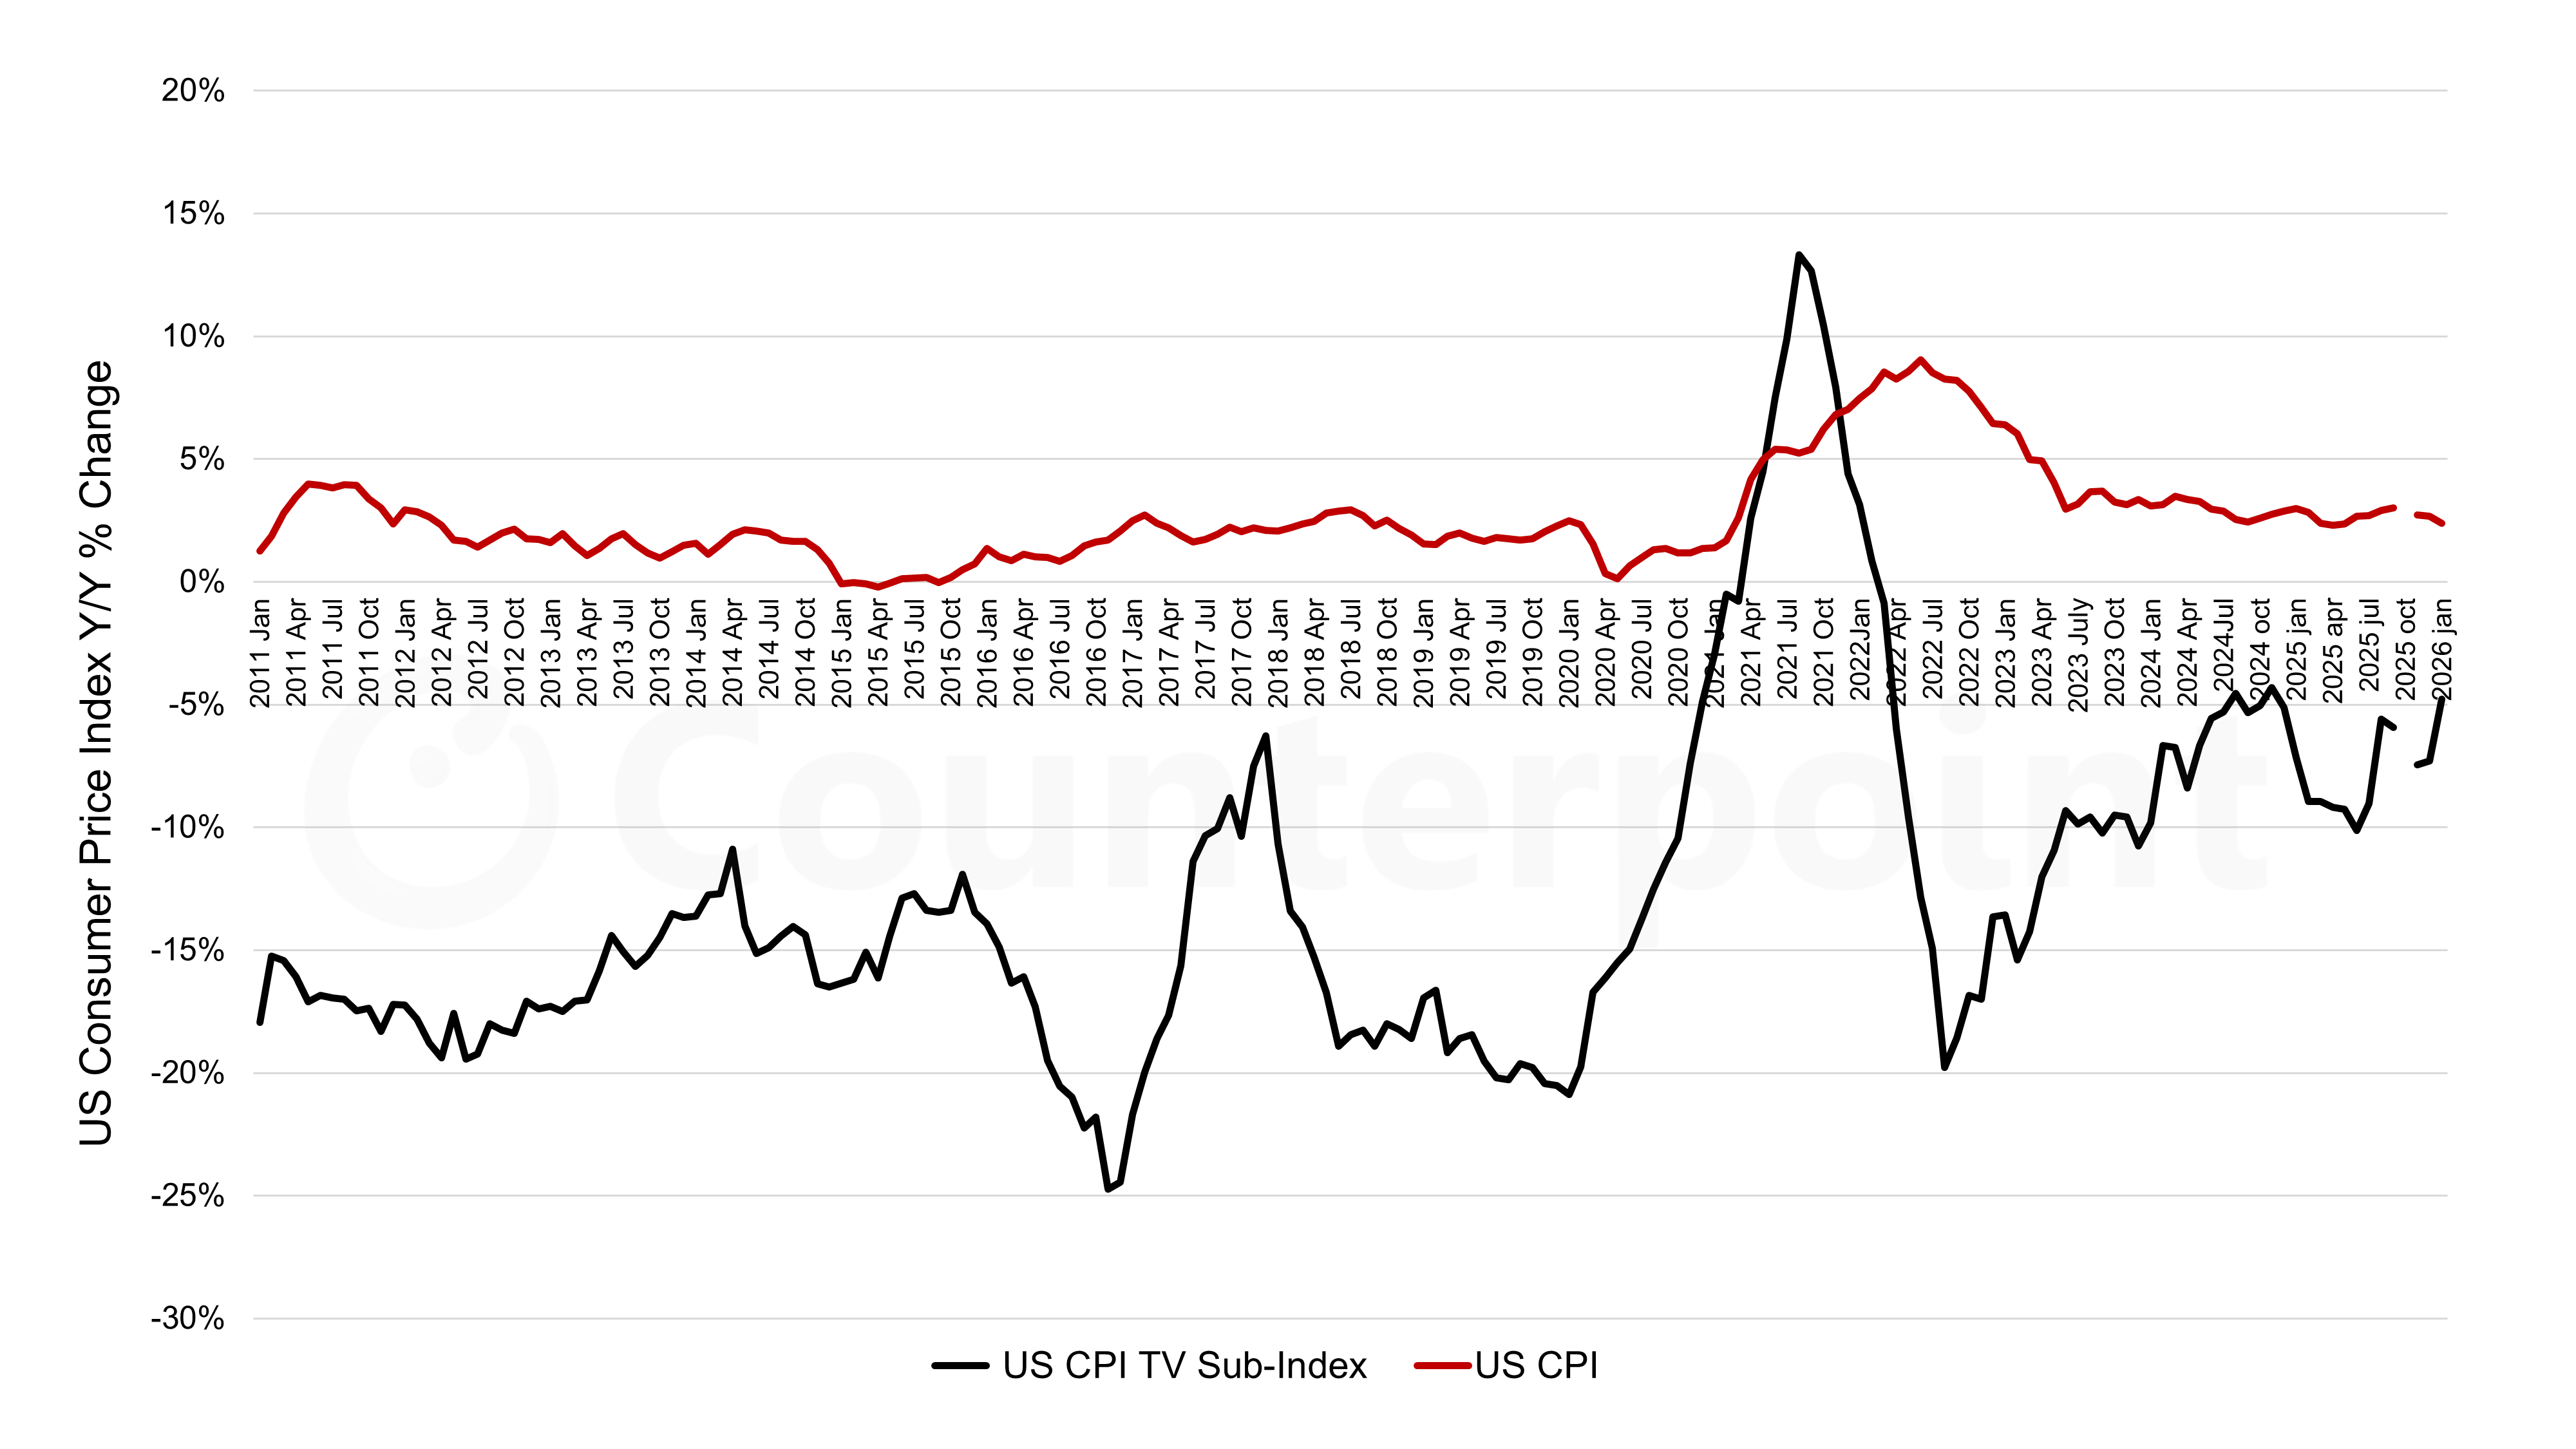
The chart here shows the YoY change in the CPI, which readers may recognize as the more familiar headline definition of inflation, and in the CPI sub-index for TV. In the period all the way back to 1997 up to 2021, the CPI for TV spent nearly the entire flat panel display era below -10%. For a period of more than 10 years from 2005 to 2017, the CPI for TV was always below -10% and often below -20%. After the spike in TV inflation in 2021 caused by pandemic demand and panel shortage, and after the post-pandemic fall in 2022-2023, YoY TV price inflation has largely remained above -10%.
The general CPI in January 2026 increased by 2.4% YoY, the lowest level since May 2025. The CPI sub-index for TVs in January 2026 decreased by 4.8% YoY, the highest (i.e. least negative) value since November 2024. While TV inflation spent the first half of 2025 near -10%, since August it has averaged -6%.
Value of US TV Imports by Country, 2023-2025
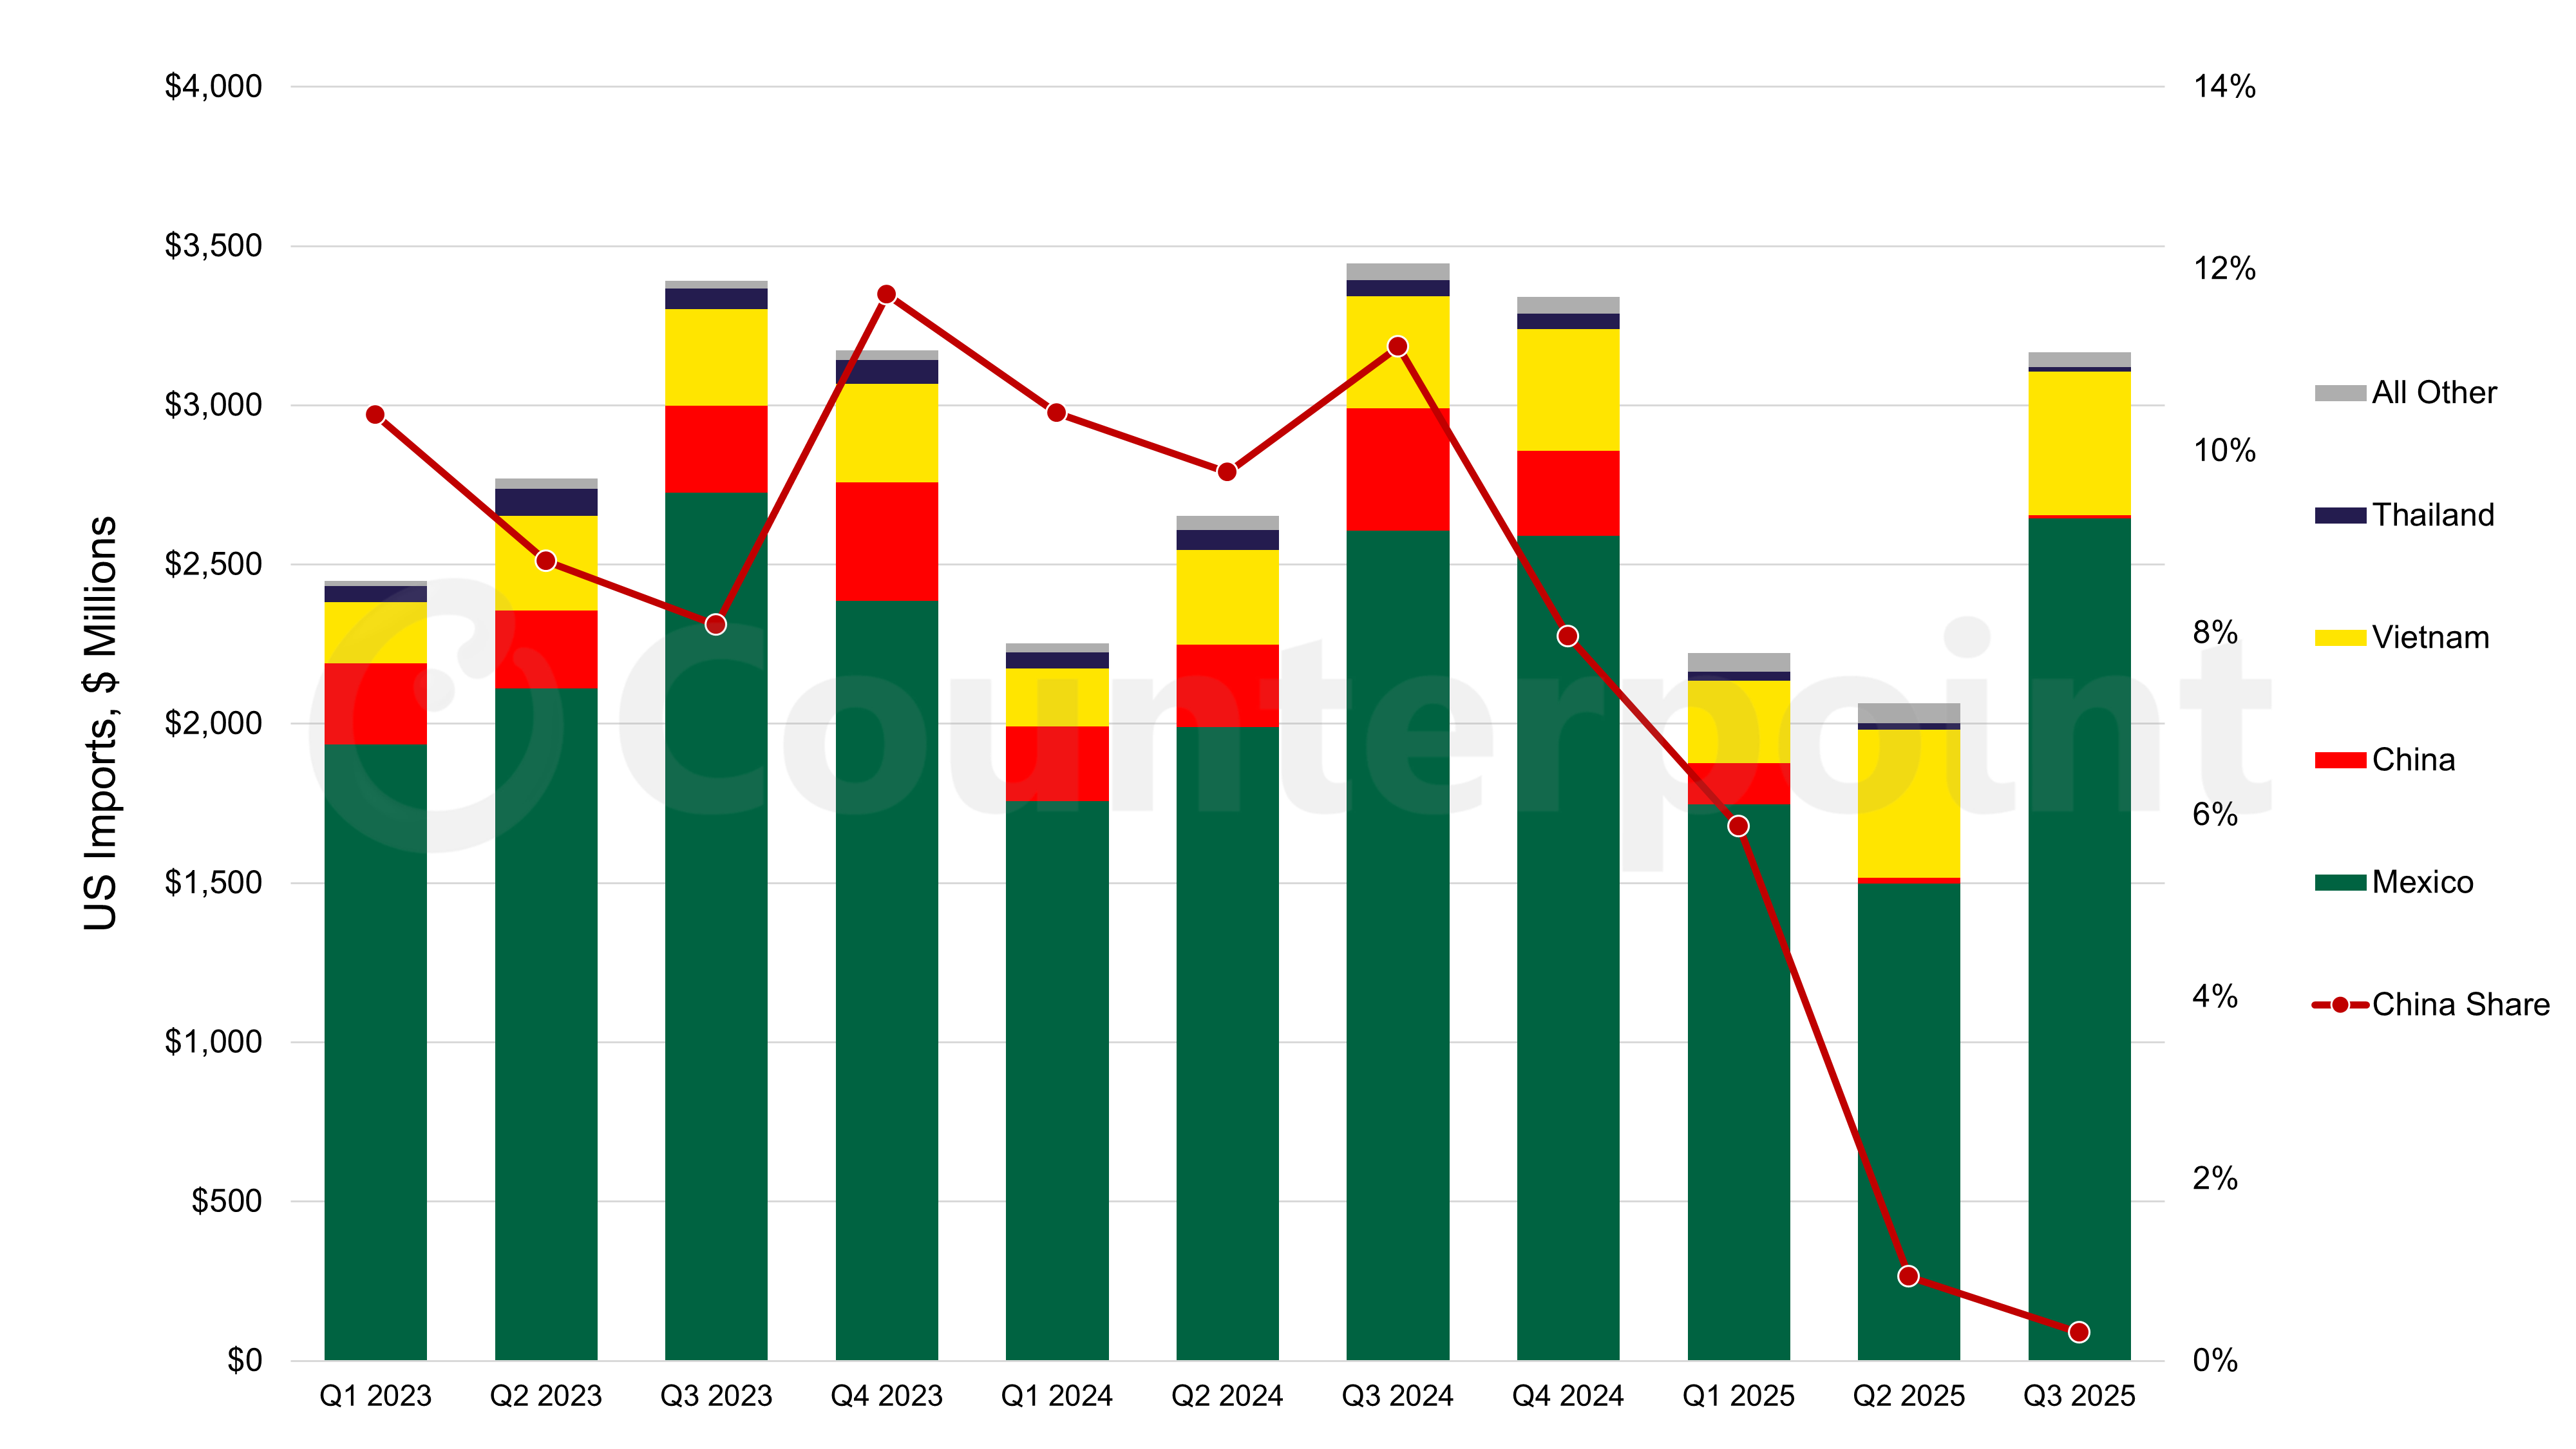
At first impression, Trump’s “reciprocal” tariffs may not have had much influence on TV prices, even though nearly all TVs sold in the US are imported. Most TVs are imported from Mexico, and are not subject to the reciprocal tariffs or any tariffs under the USMCA trade deal. However, some TVs have been imported from China, Vietnam, Thailand and other countries.
After Q1 2025, the share of TV imports from China has dropped to near zero, and in Q3 2025, the share from Mexico reached 84%, higher than at any time since before 2017. Although TV imports from Mexico do not face a duty, it is likely that production costs for Mexico are higher than for China or Vietnam, and therefore, by shifting the supply chain, the Trump tariffs are putting upward pressure on prices.
Since most TVs use LCD panels, and since the display panel is the highest-value component in a TV, it would make sense that the trends for LCD TV panel prices would correlate with the trends for TV prices. We have found that to be the case, with a five-month lag as shown in the next chart.
US TV CPI With 5-Month Lag vs Panel Price Index (PPI)
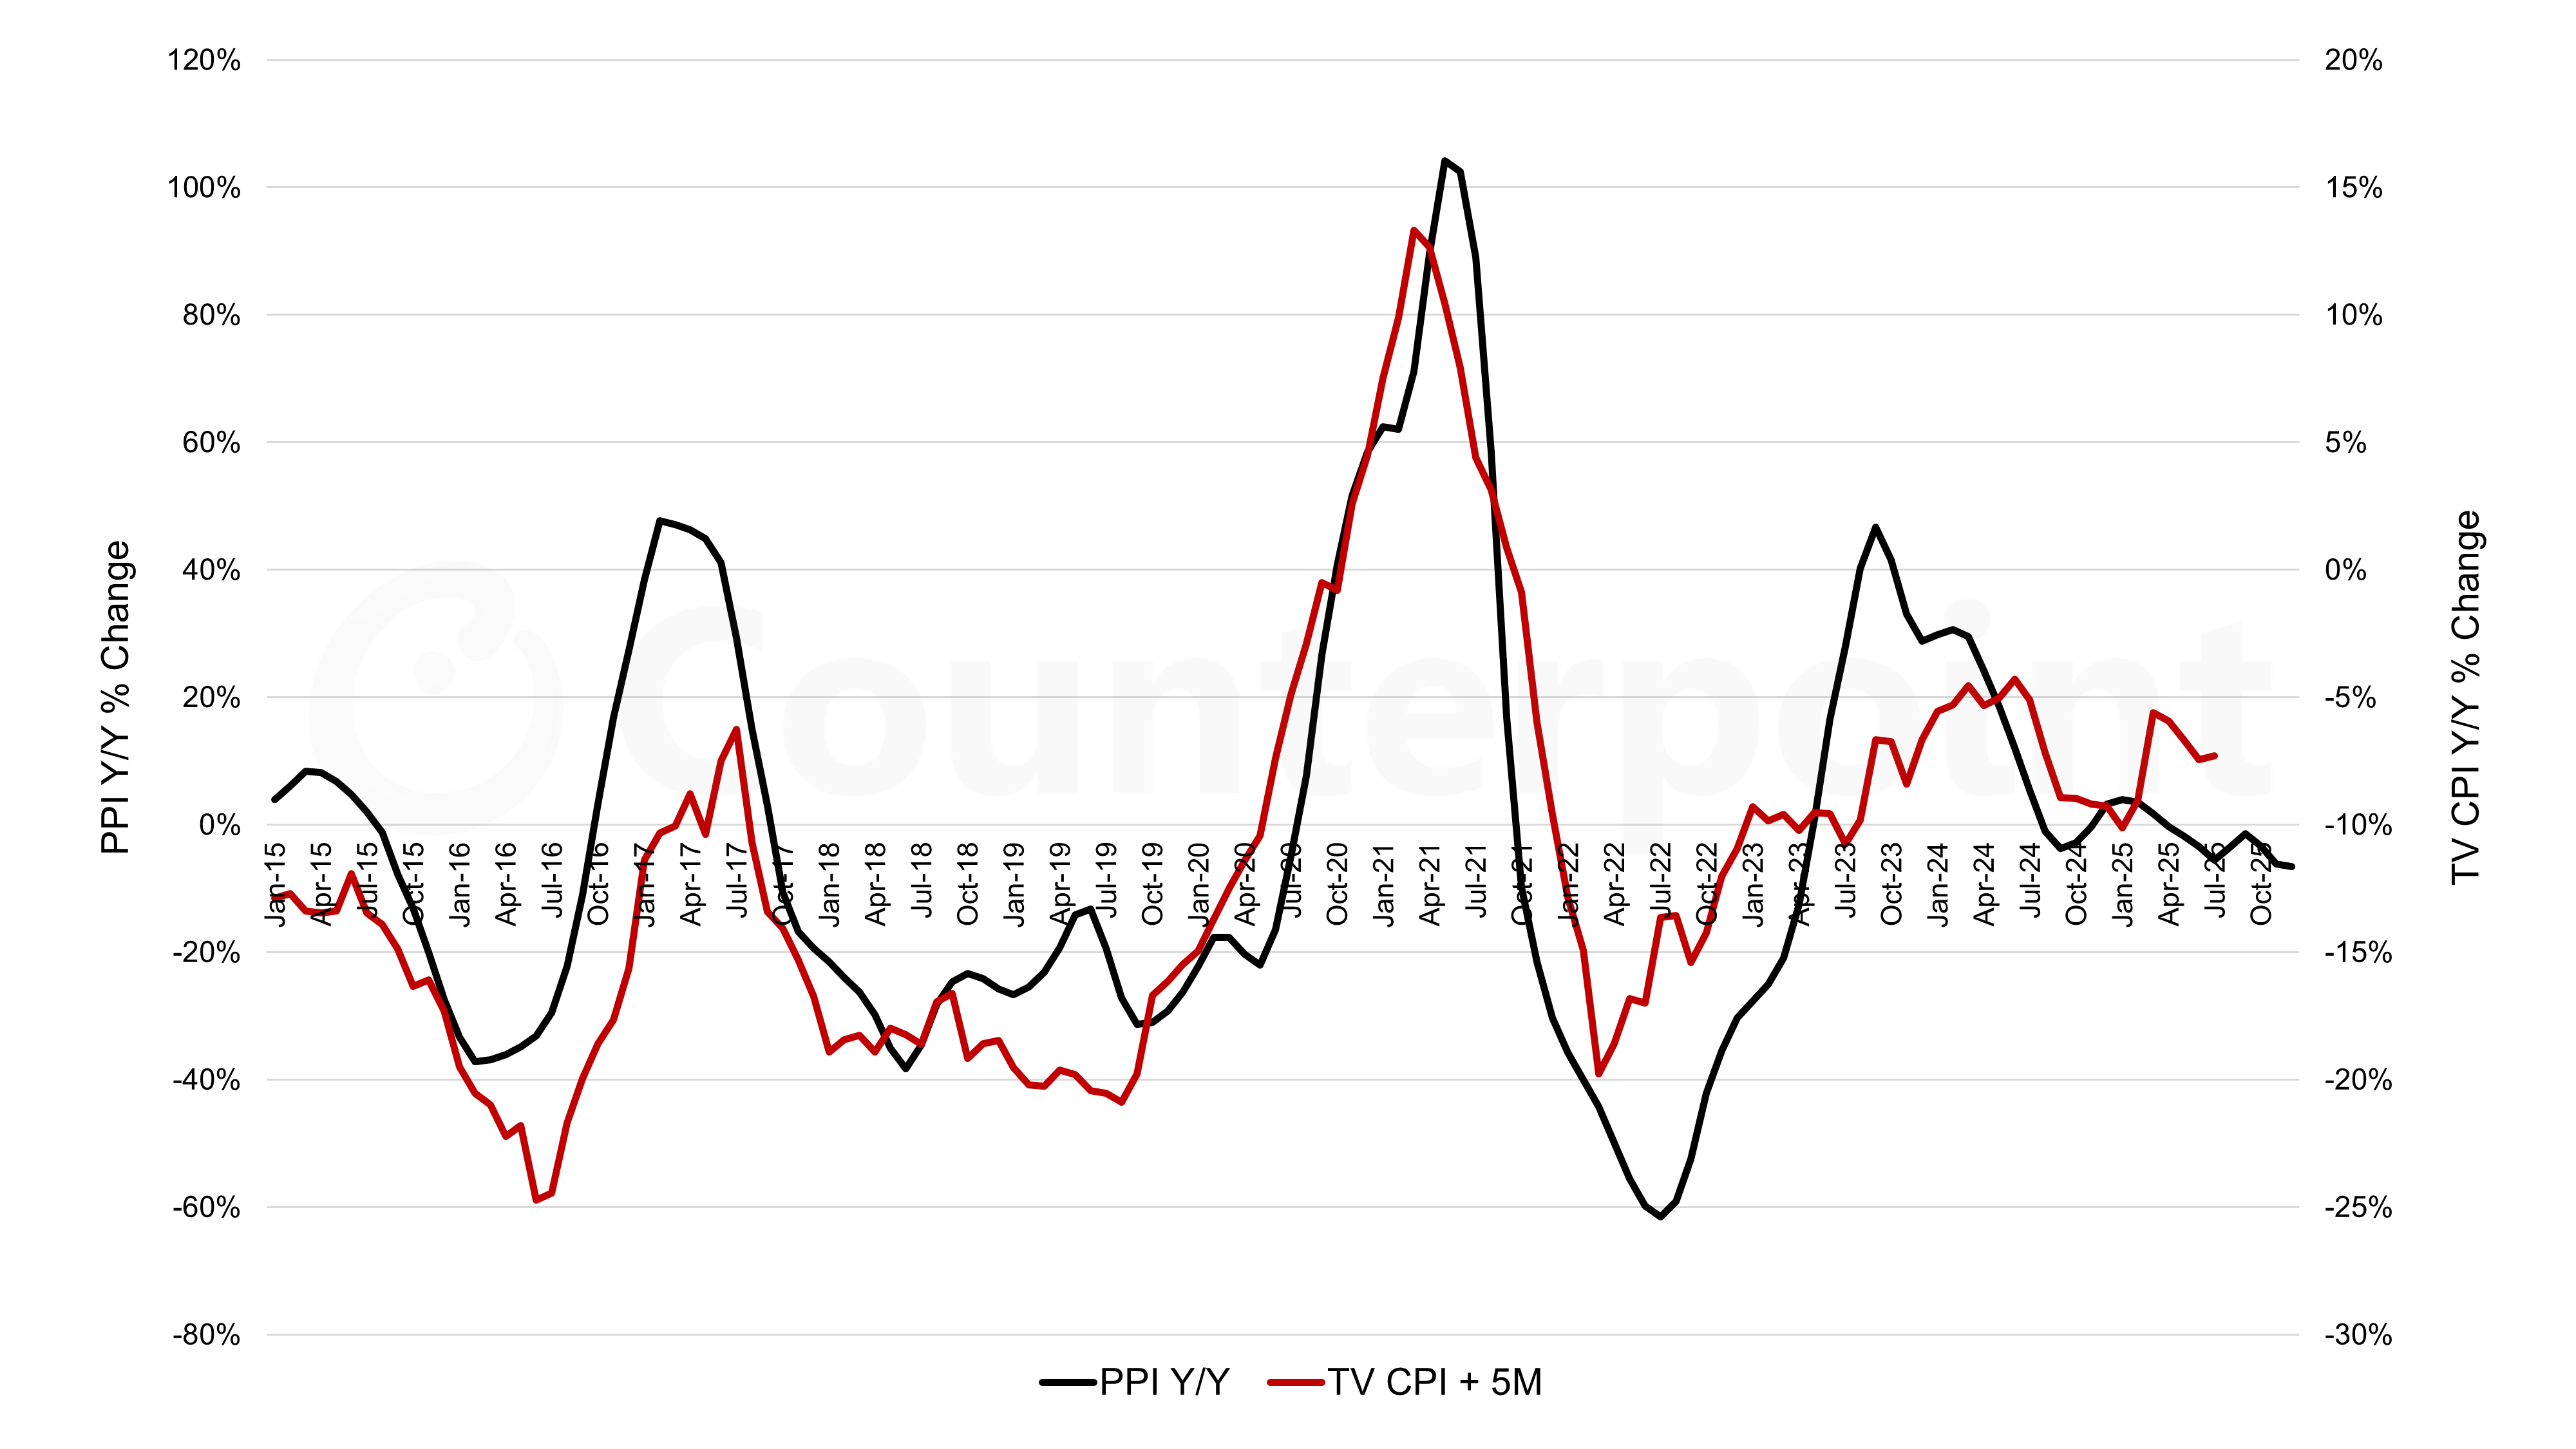
As the chart implies, TV prices are highly correlated to panel prices, but with a time lag. A linear regression of the YoY change in TV prices (TV CPI) against panel prices (PPI) leads to the following equation modeling TV inflation, with an R-squared of 62%:
TV CPI YoY % = 0.18 * (PPI YoY%, T – 5 months) - 11%
The Y-intercept of this equation suggests that when panel prices are flat YoY, TV inflation will be -11% three months later. The slope of the equation says that a 10% change in panel prices YoY will result in a 1.6% change in TV inflation after three months. Finally, calculating the X-intercept of the equation (dividing 11% by 0.18) yields 61%. This suggests that a 61% increase in panel prices YoY will lead to TV inflation of 0% three months later, and that is exactly what happened during the pandemic. Recently, LCD TV panel prices have been close to flat YoY, and according to this regression, this suggests that TV prices should decrease by 11% YoY, so when the TV price decrease is less than that, we may attribute the difference to Trump’s trade policies.
Category
Industry
Display, Macro & Geopolitics
Service
Display Market Trends
Report Type
Report
Time Period
Weekly
Receive our insightful weekly newsletter and stay ahead of the competition.
Author
Bob Obrien
Robert J (Bob) O’Brien joined Counterpoint Research as part of its acquisition of DSCC, where he was Co-Founder, Principal and CFO of DSCC. Bob has decades of experience turning market and business analysis into strategic insights in the display and electronics industries. At DSCC, Bob takes the lead role in analysis of display materials, including glass and AMOLED materials, and covers developments in TV and other large-screen display applications. He is the principal author of DSCC’s AMOLED Material Report, the Advanced TV Shipment Report, and the Display Glass Report, and Bob contributes regularly to the DSCC Weekly Review.