Electronics Supply Chain Continues to Shift Away from Mainland China
The global supply chain for electronics has been concentrated in Mainland China, but 2025 marked an inflection point as the shift away from Mainland China accelerated in reaction to President Trump’s tariff regime. The trend set in 2025 continued into 2026, based on import data for the first quarter released by the US International Trade Commission (ITC).
The seasonal pattern of imports in 2025 was dominated by the wild swings in Trump’s tariff policy. When tariffs were just a threat and not yet in place, imports surged in Q1 2025. As Trump announced massive tariffs in April and then backed away from some of the most severe, some imports continued at a strong pace in Q2, but with a big shift away from Mainland China. As some trade deals were reached and some tariffs were stabilized, imports settled into a new normal in the second half of the year.
In Q1 2026, the US Supreme Court struck down Trump’s “reciprocal” tariffs, whereupon he announced a 10% tariff on most goods from most countries under a separate emergency authority. That authority will expire in mid-July, and Trump is seeking a more lasting justification. The US Trade Representative has initiated investigations into more than 60 countries under Section 301 of the US Trade Act of 1974. Section 301 allows the president to impose tariffs on countries found to be using unfair trade practices. In Trump’s first term in office, he imposed tariffs on China under Section 301 in 2019 after an investigation concluded that China was guilty of unfair trade practices. None of the recent investigations has been concluded, but it is expected that many or all of them will be concluded before the temporary tariffs expire.
Thus, in Q1 2026, importers faced some uncertainty around tariffs, but the range of uncertainty was lower than in 2025. With that context, we will dig into the results from the import data.
The Harmonized Tariff Schedule (HTS) details all products with a tariff code, and Chapter 85 covers TVs, smartphones and most other electronic goods (except PCs, which are in Chapter 84). The typical seasonal pattern is a slowdown in Q1 but then an increase in each quarter through Q4.
The US imported Chapter 85 goods worth $131 billion in Q1 2026, an increase of 10% YoY. In terms of countries, imports from Mainland China decreased 54% YoY to $13 billion, and Mainland China’s share of Chapter 85 imports fell from 23% in Q1 2025 to 10% in Q1 2026. Mexico was the largest source of Chapter 85 imports in Q1 2026, with exports from Mexico increasing 10% YoY to $23 billion. Imports from six other Asian countries increased YoY, with semiconductors for AI data centers driving much of the increase.
- Vietnam: +43% YoY to $20 billion
- Taiwan: +39% YoY to $11 billion
- Thailand: +76% YoY to $11 billion
- India: +18% YoY to $9 billion
- South Korea: +46% YoY to $7 billion
- Japan: +10% YoY to $5 billion
Imports from Malaysia bucked the regional trend, falling 3% YoY to $7 billion.
US Imports of HTS Chapter 85 Goods by Country, Q1 2024 – Q1 2026
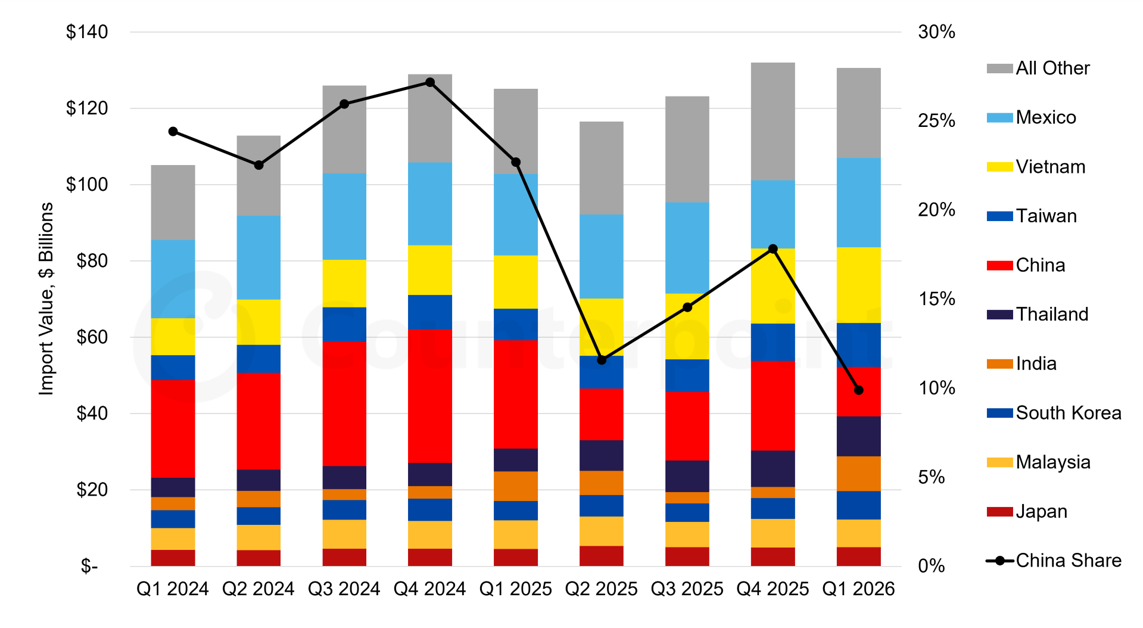
The shift away from Mainland China had been happening steadily since its share peaked at 43% in 2018. In that year, importers rushed to bring in products before punitive tariffs were implemented by President Trump in his first term. Those punitive tariffs, which included a 7.5% levy on TVs from Mainland China, remain in place today. Mainland China’s share decreased an average of 3% per year from 2018 to 2024, but this accelerated with an 8% decrease in 2025 and a 13% decrease in Q1 2026.
The biggest single revenue category among electronics is smartphones. Here, the YoY numbers are skewed by the anomaly in Q1 2025, as importers rushed to get products into the country before Trump’s tariffs took effect. Smartphone imports decreased 14% YoY in units and 16% YoY in revenue in Q1 2026, but the pattern by country shifted dramatically. Imports from Mainland China decreased 68% YoY in units and 70% YoY in value, while imports from India increased 7% YoY in units and 16% YoY in value. The average price of a phone imported from India increased from $465 in Q1 2025 to $499 in Q1 2026, an indication of a richer mix of iPhones....
Download the report to continue reading.
Category
Industry
Display
Service
Display Market Trends
Report Type
Report
Time Period
Weekly
Receive our insightful weekly newsletter and stay ahead of the competition.
Author
Bob Obrien
Robert J (Bob) O’Brien joined Counterpoint Research as part of its acquisition of DSCC, where he was Co-Founder, Principal and CFO of DSCC. Bob has decades of experience turning market and business analysis into strategic insights in the display and electronics industries. At DSCC, Bob takes the lead role in analysis of display materials, including glass and AMOLED materials, and covers developments in TV and other large-screen display applications. He is the principal author of DSCC’s AMOLED Material Report, the Advanced TV Shipment Report, and the Display Glass Report, and Bob contributes regularly to the DSCC Weekly Review.