Display Capacity Growth Slows in Q2 2026 as Sharp K2 Closure Reshapes Market Dynamics
0
June 2, 2026
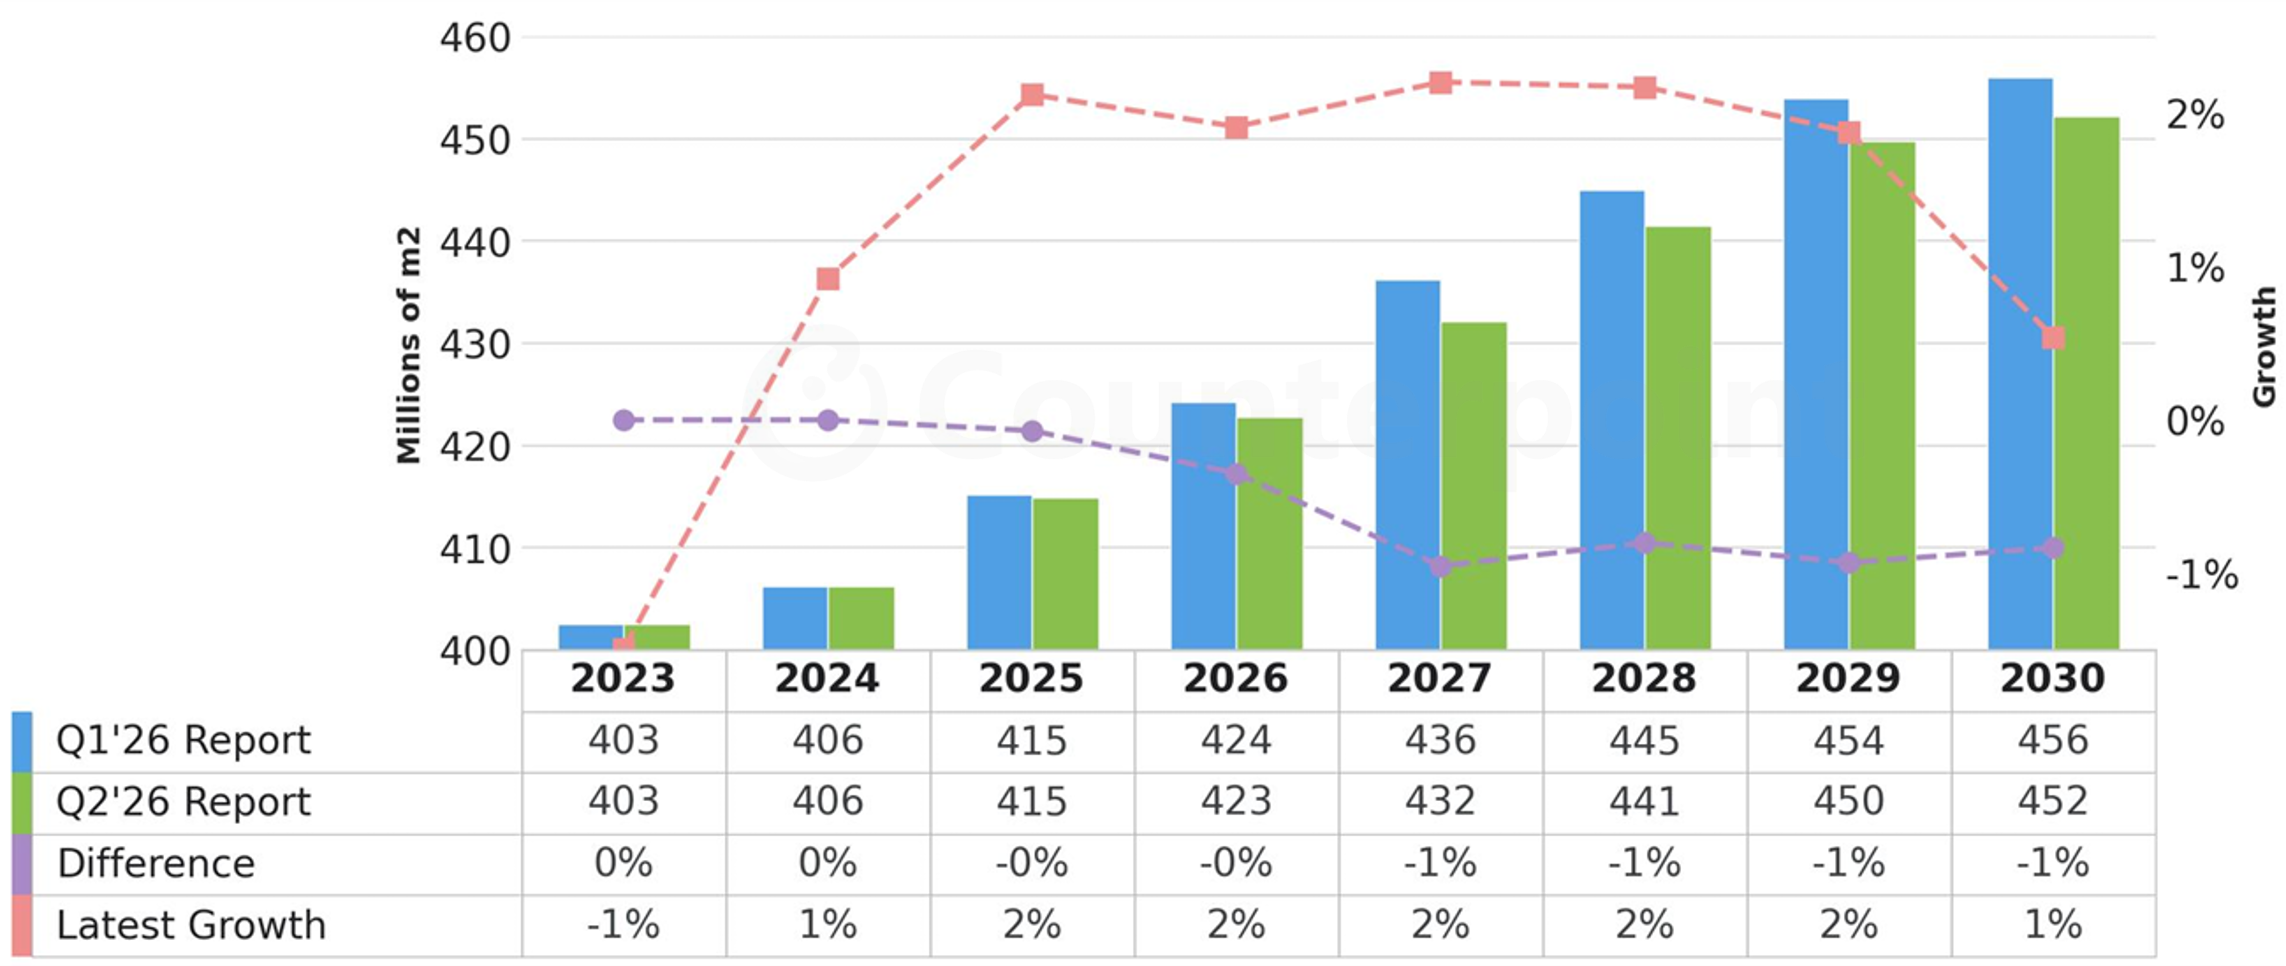
Global display capacity is now expected to grow at a 1.7% CAGR from 2025 to 2030, down from the 1.9% CAGR forecast published in Q1 2026, according to Counterpoint’s latest Quarterly Display Capex and Equipment Report. The downward revision primarily reflects the planned closure of Sharp’s Kameyama K2 Gen 8.5 LCD fab, along with limited incremental capacity additions across the industry.
While display capacity is still expected to expand annually, the latest forecast implies approximately 1% lower cumulative capacity during the 2025-2030 period compared to the previous quarter’s outlook.
Display Capacity Forecasts
Source: Counterpoint Research Quarterly Display Capacity Report
Sharp K2 closure accelerates industry consolidation
Sharp’s K2 shutdown represents more than just a capacity reduction. It signals the continued consolidation of LCD manufacturing into China, especially for large-area IT and TV applications.
Apple’s IT LCD production previously handled by K2 is expected to shift mainly to BOE, with LG Display as a secondary supplier. This transition further strengthens China’s role not only in volume manufacturing, but also in premium notebook and tablet display supply chains.
Japan’s overall display manufacturing footprint will continue shrinking rapidly. Following JDI’s Mobara OLED fab closure in Q4 2025, Sharp’s K2 shutdown is expected to reduce Japan’s display capacity share from 1% in 2025 to just 0.5% by 2030.
China continues to tighten its grip on global display manufacturing
China remains the dominant force in display manufacturing and is expected to increase its share of global capacity from 73% in 2025 to 76% by 2030, supported by a 2.6% CAGR over the forecast period. Meanwhile:
South Korea is expected to maintain a relatively stable 8% share.
Taiwan’s share is projected to decline from 17% to 15%.
Japan’s contribution continues to diminish due to fab closures.
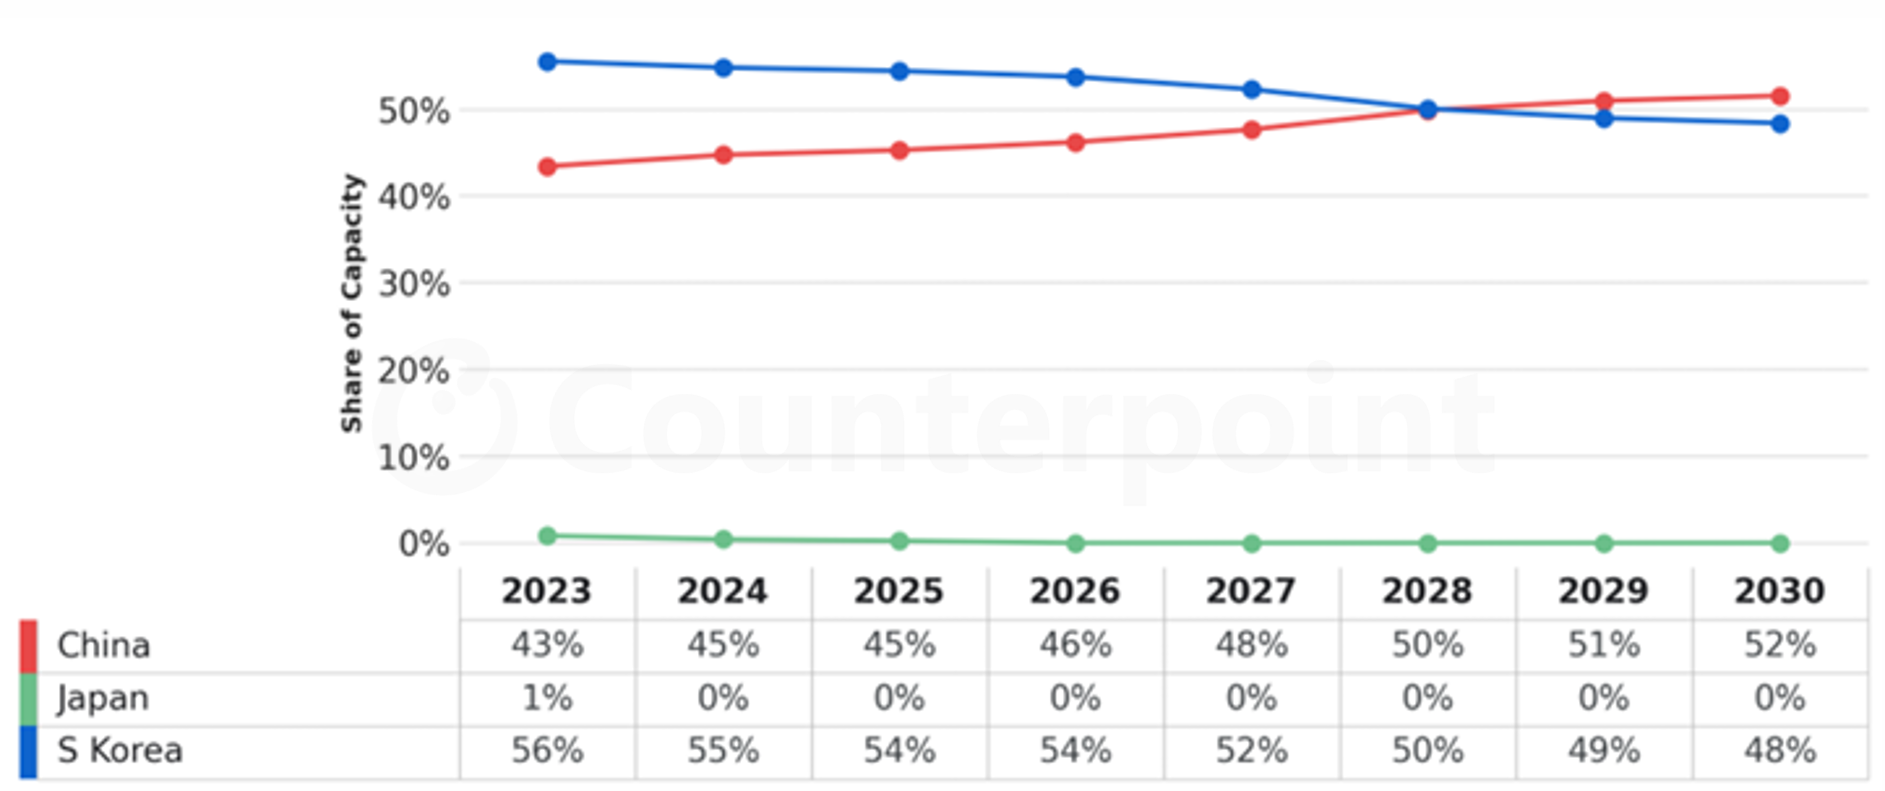
OLED Capacity by Region
Source: Counterpoint Research Quarterly Display Capacity Report
In OLED specifically, China is expected to surpass South Korea in capacity share by 2029, reaching 51% share versus South Korea’s 49%. This transition reflects China’s aggressive investments in flexible OLED, LTPO and Gen 8.7 IT OLED capacity, particularly from companies such as BOE, Visionox and CSOT.
OLED mobile/IT remains the fastest-growing segment
OLED mobile/IT capacity continues to be the industry’s strongest long-term growth engine, expected to grow at a 6.1% CAGR from 2025 to 2030. Several structural drivers continue supporting this growth:
Rising OLED penetration in notebooks and tablets
Premium smartphone LTPO adoption
Expansion of Gen 8.7 IT OLED fabs
Increasing demand for low-power variable refresh rate displays
At the same time, LCD mobile/IT capacity growth remains nearly flat at just 0.2% CAGR as older a-Si fabs are gradually phased out and replaced by more advanced LTPS and oxide technologies.
LTPO expansion gains momentum
One of the most notable technology trends remains the continued expansion of LTPO backplane capacity.
LTPO display capacity is expected to grow at an 11% CAGR through 2030, reaching a 4% share of total display capacity and 34% of OLED capacity. The growth is being fuelled by:
Premium smartphone demand for adaptive refresh rate displays
Improved power efficiency requirements
BOE and Visionox’s LTPO adoption in Gen 8.7 OLED
Future premium IT OLED applications
Interestingly, oxide growth could have been even stronger if more Gen 8 OLED makers had adopted oxide-only approaches. Instead, several manufacturers continue to prefer LTPS or LTPO structures for performance optimization.
G7+ capacity growth remains tight: Potential TV panel shortage risk
Another major takeaway from the report is the relatively modest growth outlook for G7+ LCD and OLED capacity. G7+ capacity is now expected to grow at only 2.1% CAGR from 2025 to 2030. While capacity recovered after the weak 2023 environment, growth remains constrained despite increasing panel size demand.
This creates a potentially important industry risk. If TV demand accelerates significantly, especially through another round of Chinese consumer subsidy programs, the industry could experience meaningful large-area panel shortages due to limited new capacity additions. Average TV size migration continues to consume substrate area at a faster pace than unit growth, making supply-demand balance increasingly sensitive.
Bottom line
The Q2 2026 forecast reinforces a broader industry theme: display makers are prioritizing profitability and technology migration over aggressive capacity expansion. The result is an industry increasingly defined by:
Subscribers also gain early visibility into expected new fabs, technology transitions, and long-term supply-demand implications shaping the global display industry.
Category
Industry
Display
Service
Standard
Report Type
Report
Time Period
Other
Receive our insightful weekly newsletter and stay ahead of the competition.
Author
Nikhil Kishor
With a decade of experience in the display technology sector, Nikhil currently leads the Display 360 platform in India at Counterpoint Research, where he supports display industry clients through a combination of sales leadership, strategic consulting, and market intelligence. His expertise lies in cost modeling for display panels, supply chain analysis, and providing actionable insights across the smartphone, IT, and TV segments. Previously, he worked at Kearney, where he led cost-reduction strategies for display clients, and at Applied Materials as a Technical Lead – New Product Manufacturing Engineer, focusing on display fabrication equipment and supplier optimization.