

Growth during the quarter was led by OEMs’ aggressive sell-in.
New Delhi, Hong Kong, Seoul, London, Beijing, San Diego, Buenos Aires –August 21st, 2018
According to the latest research from Counterpoint’s Market Monitor service, in Q2 2018 the LATAM smartphone shipments grew 2% YoY in volume and 8% in value. Chile and Mexico were the markets that led the growth, driven in part by Huawei and Motorola.
Commenting on the findings Senior Analyst, Tina Lu, said, “LATAM’s smartphone sell-in grew a marginal 2%, despite the economic volatility created by political turbulence. Motorola and Huawei led the volume growth with high double-digit growth, benefiting from the aggressive launch of new products in the mid-range (USD $100-$250) segment.”
Adding further, Tina said, “Consumers in Latin America are slowing down in their replacement rate but investing more money per purchase. Despite the multiple devaluations that most LATAM currencies have experienced during Q2 2018, the smartphone average selling price (ASP) reached USD187, around an 8% YoY increase. This was the region’s highest ASP ever. LATAM device prices are highly sensitive to currency fluctuations, as most of the countries in the region import devices, and those that require local manufacturing, still depend highly on sourcing parts internationally. Price band growth has been polarizing at both ends of the price spectrum.”
Exhibit 1: LATAM Smartphone Shipment Share by Brands

Source: Counterpoint Research: Quarterly Market Monitor Q2 2018
Commenting on the region’s brand evolution, Research Analyst, Parv Sharma, said, “Consumers in the LATAM region need to trust the brand before adopting it. So, this leads to quite a concentrated market with the top five brands, representing almost three-quarters of all the smartphones shipped. These brands have all invested a great deal of resources both in terms of money and management time, within the region, to earn local consumer trust. Huawei enjoyed a 43% YoY growth, the biggest surge among the top five brands. Its success is a result of the company consistently building brand awareness in the region. It has also increased its presence in America Movil. But the channel is quite stacked with Huawei inventory. Motorola also had double digit volume increase, but its volume growth was leveraged by the C series which took a toll on its ASP.”
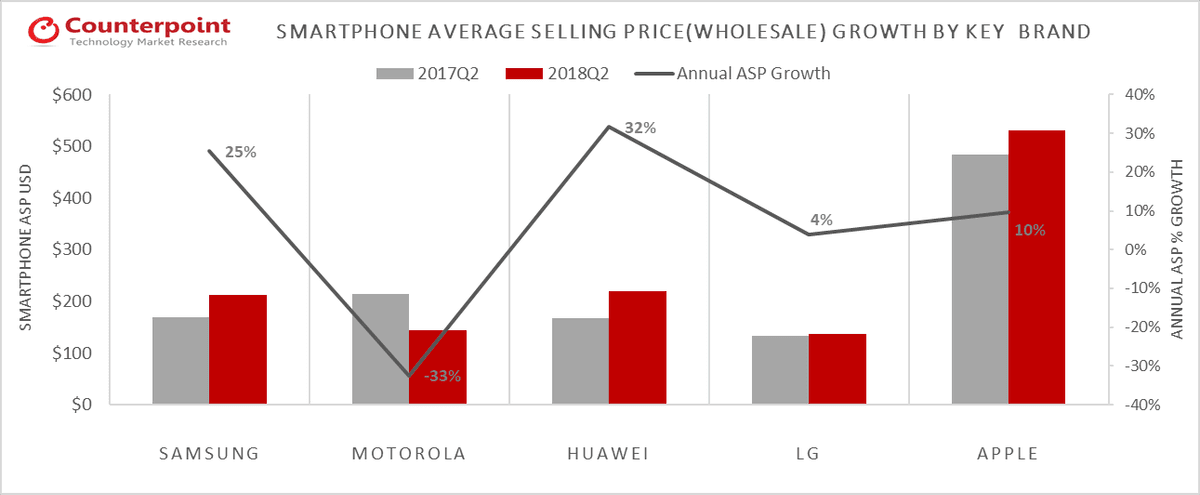
Exhibit 2: LATAM ASP evolution: Q2 2017 vs Q2 2018
Source: Counterpoint Research: Quarterly Market Monitor Q2 2018
Market Summary:
- Samsung captured more than 36% of the LATAM market. It was, once again, the absolute leader in the market, but it lost share YoY.
- Despite the decline in share, Samsung had a 25% increase in ASP, thanks to increasing midrange sales.
- Motorola reached 12.4% market share. The refreshed models in the E and G series have increased Motorola’s overall sell-in volumes. However, its Moto C is still the best-selling model and this success affected its ASP, driving it to decline 33% YoY.
- Huawei reached 11.8% market share. It was third in the market, but just 0.8pp behind Motorola.
- Huawei’s ASP increased 32% YoY. It is the brand with the highest growth amongst the top selling brands.
- LG had the biggest YoY drop; a decline of more than 26%. It is the only brand in the top five chart that had flat YoY movement on ASP.
- Apple remained almost flat with 4% market share, though it had more than 10% growth in ASP.
- Apple’s ASP growth was driven by the launch of iPhone X which was offset by strong sales of iPhone 6 in the region.
The comprehensive and in-depth Q2 2018 Market Monitor is available for subscribing clients. Please feel free to contact us at [email protected] for further questions regarding our in-depth latest research, insights or press enquiries.
The Market Monitor research is based on sell-in (shipments) estimates based on vendor’s IR results, vendor polling triangulated with sell-through (sales), supply chain checks and secondary research.
Analyst Contacts:
Tina Lu
+54 91160411221
[email protected]
Parv Sharma
+91 974-259-6030
[email protected]
Peter Richardson
+44 791-723-1934
[email protected]
Follow Counterpoint Research
press(at)counterpointresearch.com


