

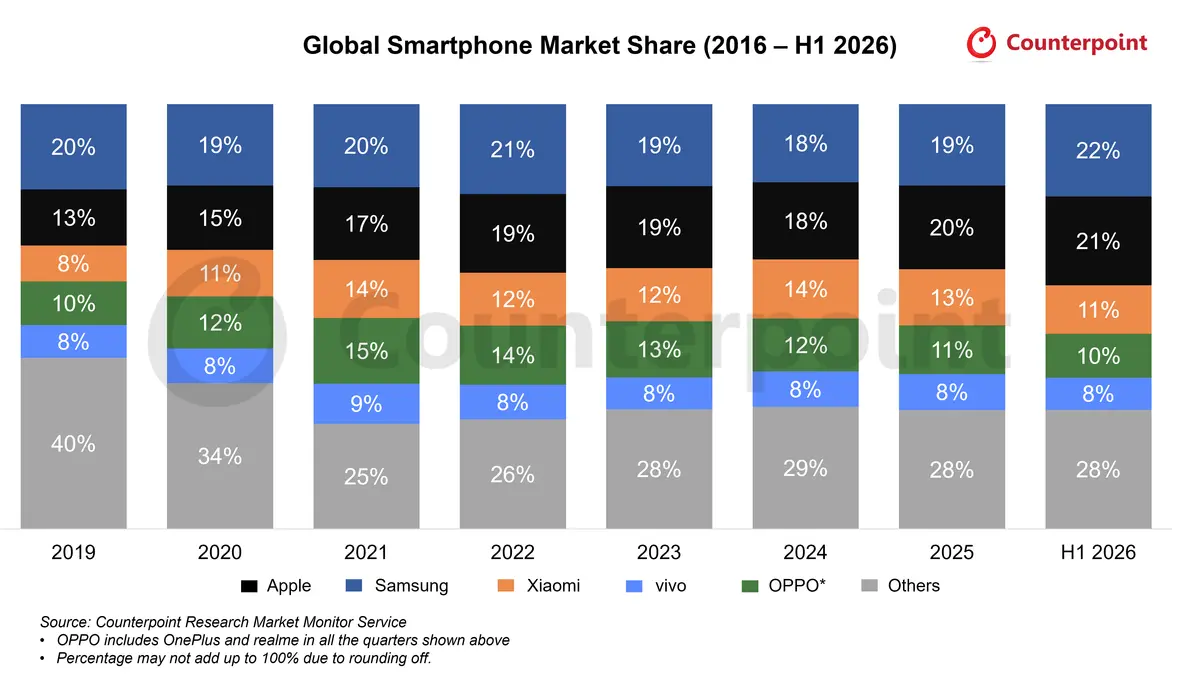
| Brands | 2019 | 2020 | 2021 | 2022 | 2023 | 2024 | 2025 | H1 2026 |
| Samsung | 20.1% | 19.2% | 19.6% | 21.2% | 19.3% | 18.4% | 19.2% | 21.8% |
| Apple | 13.2% | 15.1% | 17.1% | 18.5% | 19.3% | 18.2% | 19.7% | 20.9% |
| Xiaomi | 8.4% | 10.9% | 13.7% | 12.4% | 12.5% | 13.9% | 13.2% | 11.4% |
| OPPO* | 10.3% | 12.3% | 15.5% | 13.9% | 13.2% | 12.5% | 11.5% | 10.3% |
| vivo | 7.7% | 8.2% | 9.4% | 8.2% | 7.5% | 8.3% | 8.5% | 7.6% |
| Others | 40.3% | 34.3% | 24.8% | 25.8% | 28.2% | 28.7% | 28.0% | 28.1% |
MARKET HIGHLIGHTS
- The global smartphone market declined 7% YoY in Q2 2026 as memory shortages and rising prices intensified. Frontloaded shipments by some OEMs softened the decline.
- Developed markets remained resilient due to higher premium exposure. North America grew 6% YoY, while Western Europe declined just 1%.
- Samsung reclaimed the global lead with 23% share and 9% YoY growth, supported by favorable pricing and competitive dynamics.
- Apple grew 13% YoY to its highest Q2 share of 21%, driven by the iPhone 17 series. It was also the only major OEM to avoid price hikes.
- Xiaomi declined 26% YoY, the steepest drop among the top five, as its entry and mid tier exposure amplified the impact of rising memory costs and weaker affordability.
The global smartphone market share numbers are from:
Market Monitor - OEM Shipment by Region and Countries, Q2 2026
Excel File | Published Date: August 2026
This report is part of a series of market monitor reports which track the mobile handset market: Smartphone and Feature Phone shipments every quarter for more than 140 brands covering more than 97% of the total device shipments in the industry.


