

- Global smartphone revenue grew 3% YoY in Q3 2026 to $114 billion, as rising prices and premiumization offset a 19% YoY decline in shipments.
- The average selling price (ASP) surged 27% YoY to a record $442, driven by a higher contribution from premium devices and memory-driven price increases across OEMs.
- Apple recorded its highest-ever revenue for a third calendar quarter, capturing a record 50% share of global smartphone revenue in Q3 2026.
- Samsung ranked second with a 19% revenue share, with revenues up 14% YoY, while retaining its position as the largest smartphone brand by shipments with a 22% share.
Beijing, Berlin, Buenos Aires, Fort Collins, Hong Kong, London, New Delhi, Seoul, Taipei, Tokyo – Nov 03, 2026
Global smartphone revenue grew 3% YoY in Q3 2026 to $114 billion, despite a steep 19% YoY decline in shipments, according to Counterpoint Research's latest Market Monitor Service. Higher average selling prices (ASPs) helped support revenue growth, offsetting the sharp decline in volumes. Premiumization, a stronger product mix and memory-driven price increases across segments pushed global ASP up 27% YoY to $442, its highest-ever level for a quarter.
Commenting on the market dynamics, Senior Analyst Shilpi Jain said, “The smartphone market is increasingly facing a trade-off between volumes and value. While higher ASPs have helped cushion the impact of declining shipments on revenue, this does not necessarily translate into profitability. As rising memory costs continue to squeeze margins, OEMs are raising prices, trimming marginal SKUs (stock keeping units) and prioritizing hero products and strategic markets. The entry-level segment is particularly vulnerable, as there is little room to absorb higher costs without compromising margins. For OEMs, the bigger challenge going forward will not just be defending shipment volumes but also protecting margins while keeping devices affordable.”
Global Smartphone Market by Revenue Share, ASP, Shipment Share in Q3 2026
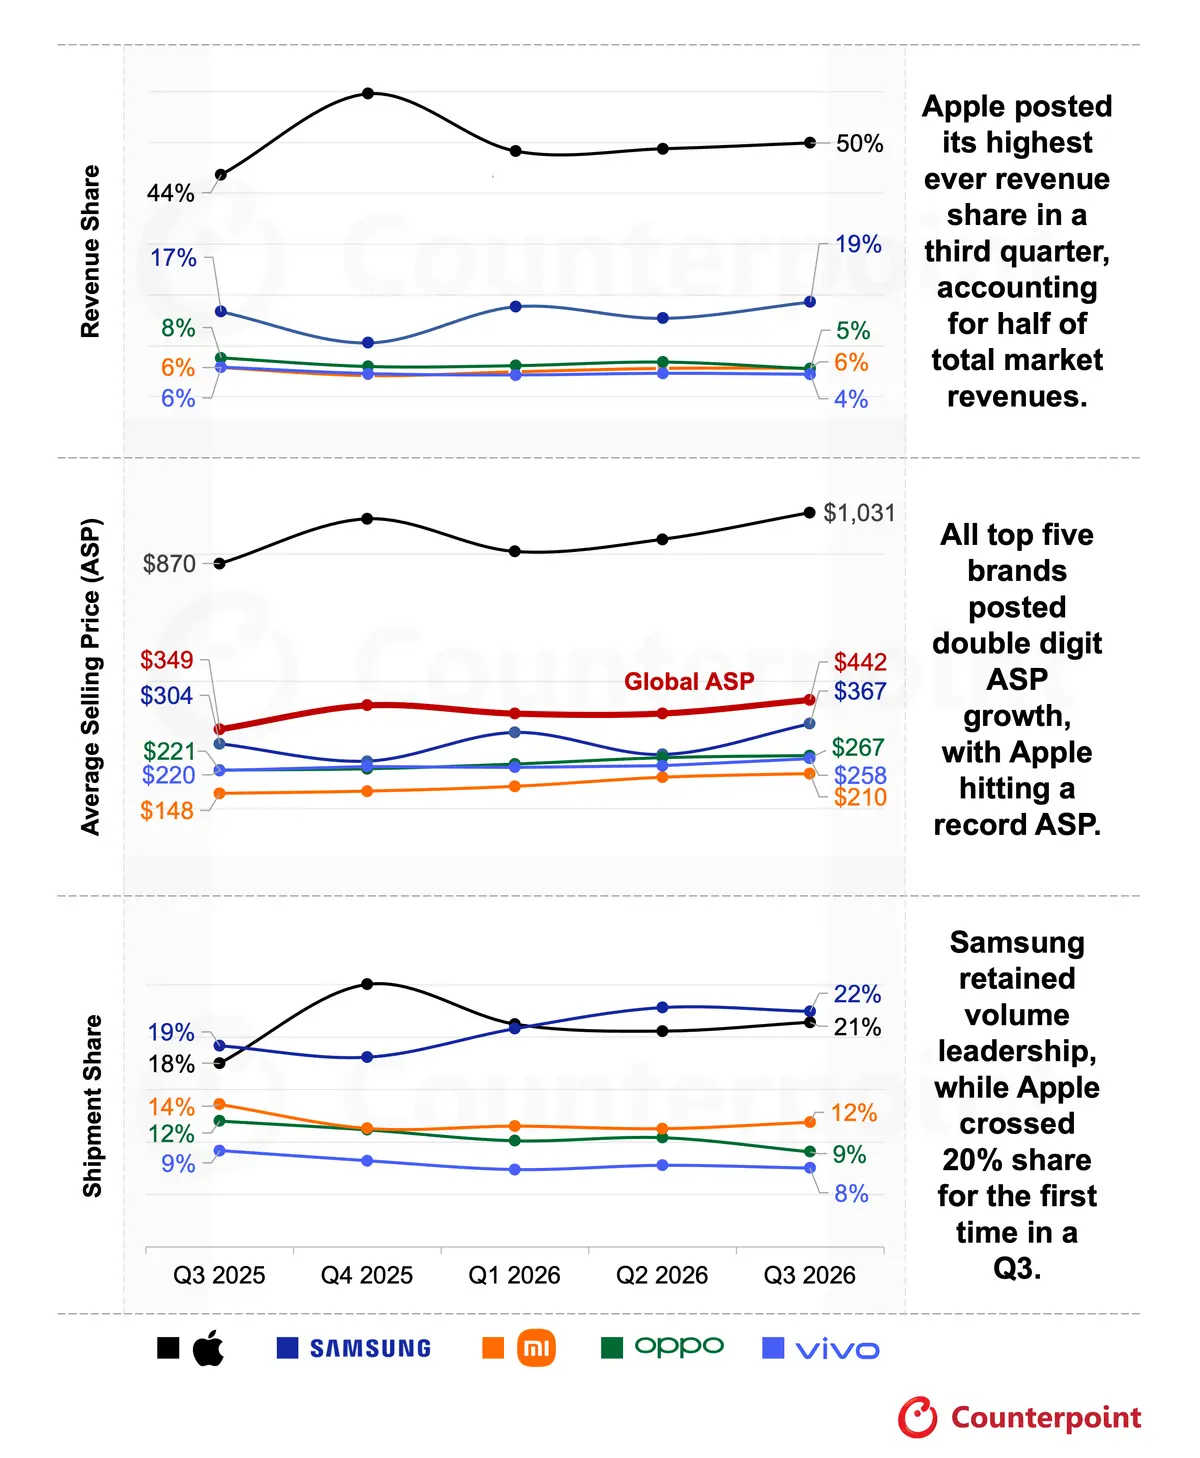
Source: Counterpoint Market Monitor Service Preliminary Data, Q3 2026
OPPO includes OnePlus and realme in all quarters shown.
ASP is based on Wholesale Price
Apple recorded its highest-ever Q3 revenue with 17% YoY growth and captured a record 50% share of global smartphone revenue for the quarter, while its ASP also grew 19% YoY, supported by sustained demand for the iPhone 17 series and early traction for the iPhone 18 Pro series.
Commenting on Apple’s performance, Research Director Tarun Pathak said, “Apple remained the most resilient major brand in Q3 2026, with shipments nearly flat YoY. Apple has the pricing power to absorb rising memory costs and pass them on to consumers with minimal impact on demand. At the same time, ASP growth was supported by higher launch prices for the iPhone 18 Pro series, the absence of the base iPhone 18 from the launch and price increases across older models in September. Together, these factors helped Apple deliver strong revenue growth in an otherwise challenging market.”
Samsung ranked second with a 19% revenue share, with revenues up 14% YoY, while retaining its lead in shipments with a 22% share. Revenue growth was primarily driven by a 21% YoY rise in ASP to $367. ASP growth was supported by price increases across its volume-driven A series and stronger contributions from the Galaxy S26 Ultra and Z Fold8. Strong early demand for the Fold8 further supported its premium mix, while Samsung’s integrated supply chain helped cushion rising memory costs.
Xiaomi’s revenue remained flat YoY in Q3 2026. However, ASP grew by double digits, offsetting the volume contraction. This was driven by component cost pass-through and a clear portfolio shift away from the entry tier toward mid-range and upper-mid-range devices. ASP growth was further supported by a stronger contribution from higher-value models, with the Redmi Note 15 series and Xiaomi 17T featuring among the top revenue drivers across its core markets.
OPPO’s and vivo’s revenues declined 26% and 22% YoY, respectively, in Q3 2026, as shipment declines outweighed ASP growth. Both brands prioritized margins over volume, scaled back operations in non-core markets and focused on flagship and key models to strengthen brand positioning and drive revenue. OPPO recorded broader ASP gains across mid-range devices, supported by the OPPO A6 lineup, indicating an improving portfolio mix. vivo’s ASP growth remained concentrated in the upper-mid-range and premium segments, with the vivo S60 5G, V70 and X300 series contributing to its performance.
The revenue resilience seen so far is unlikely to continue into the next quarter. In Q4 2026, shipment declines are expected to outpace ASP growth, pushing global smartphone revenue into contraction. However, stronger ASPs in the first three quarters should keep full-year 2026 revenue higher YoY. In 2027, elevated memory costs will continue to pressure OEM margins and drive further price increases. Shipments are expected to decline again, though at a slower pace than in 2026, while higher ASPs should lift revenue growth above 2026 levels. Cost relief is expected only in 2028, when OEMs may reinvest savings in device upgrades rather than lower prices.
About Counterpoint Research
Counterpoint Research is a global market research firm specializing in products across the technology ecosystem. We advise a diverse range of clients – from smartphone OEMs to chipmakers and channel players to Big Tech – through our offices located in the world's major innovation hubs, manufacturing clusters and commercial centers. Our analyst team, led by seasoned experts, engages with stakeholders across the enterprise – from the C-suite to professionals in strategy, analyst relations (AR), market intelligence (MI), business intelligence (BI), product and marketing – to deliver services spanning market data, industry thought leadership and consulting. Our core areas of coverage include AI, Automotive, Consumer Electronics, Displays, eSIM, IoT, Location Platforms, Macroeconomics, Manufacturing, Networks and Infrastructure, Semiconductors, Smartphones and Wearables. Visit our Insights page to explore our publicly available market data, insights and thought leadership, and to understand our focus, meet our analysts and start a conversation.
Follow Counterpoint Research

