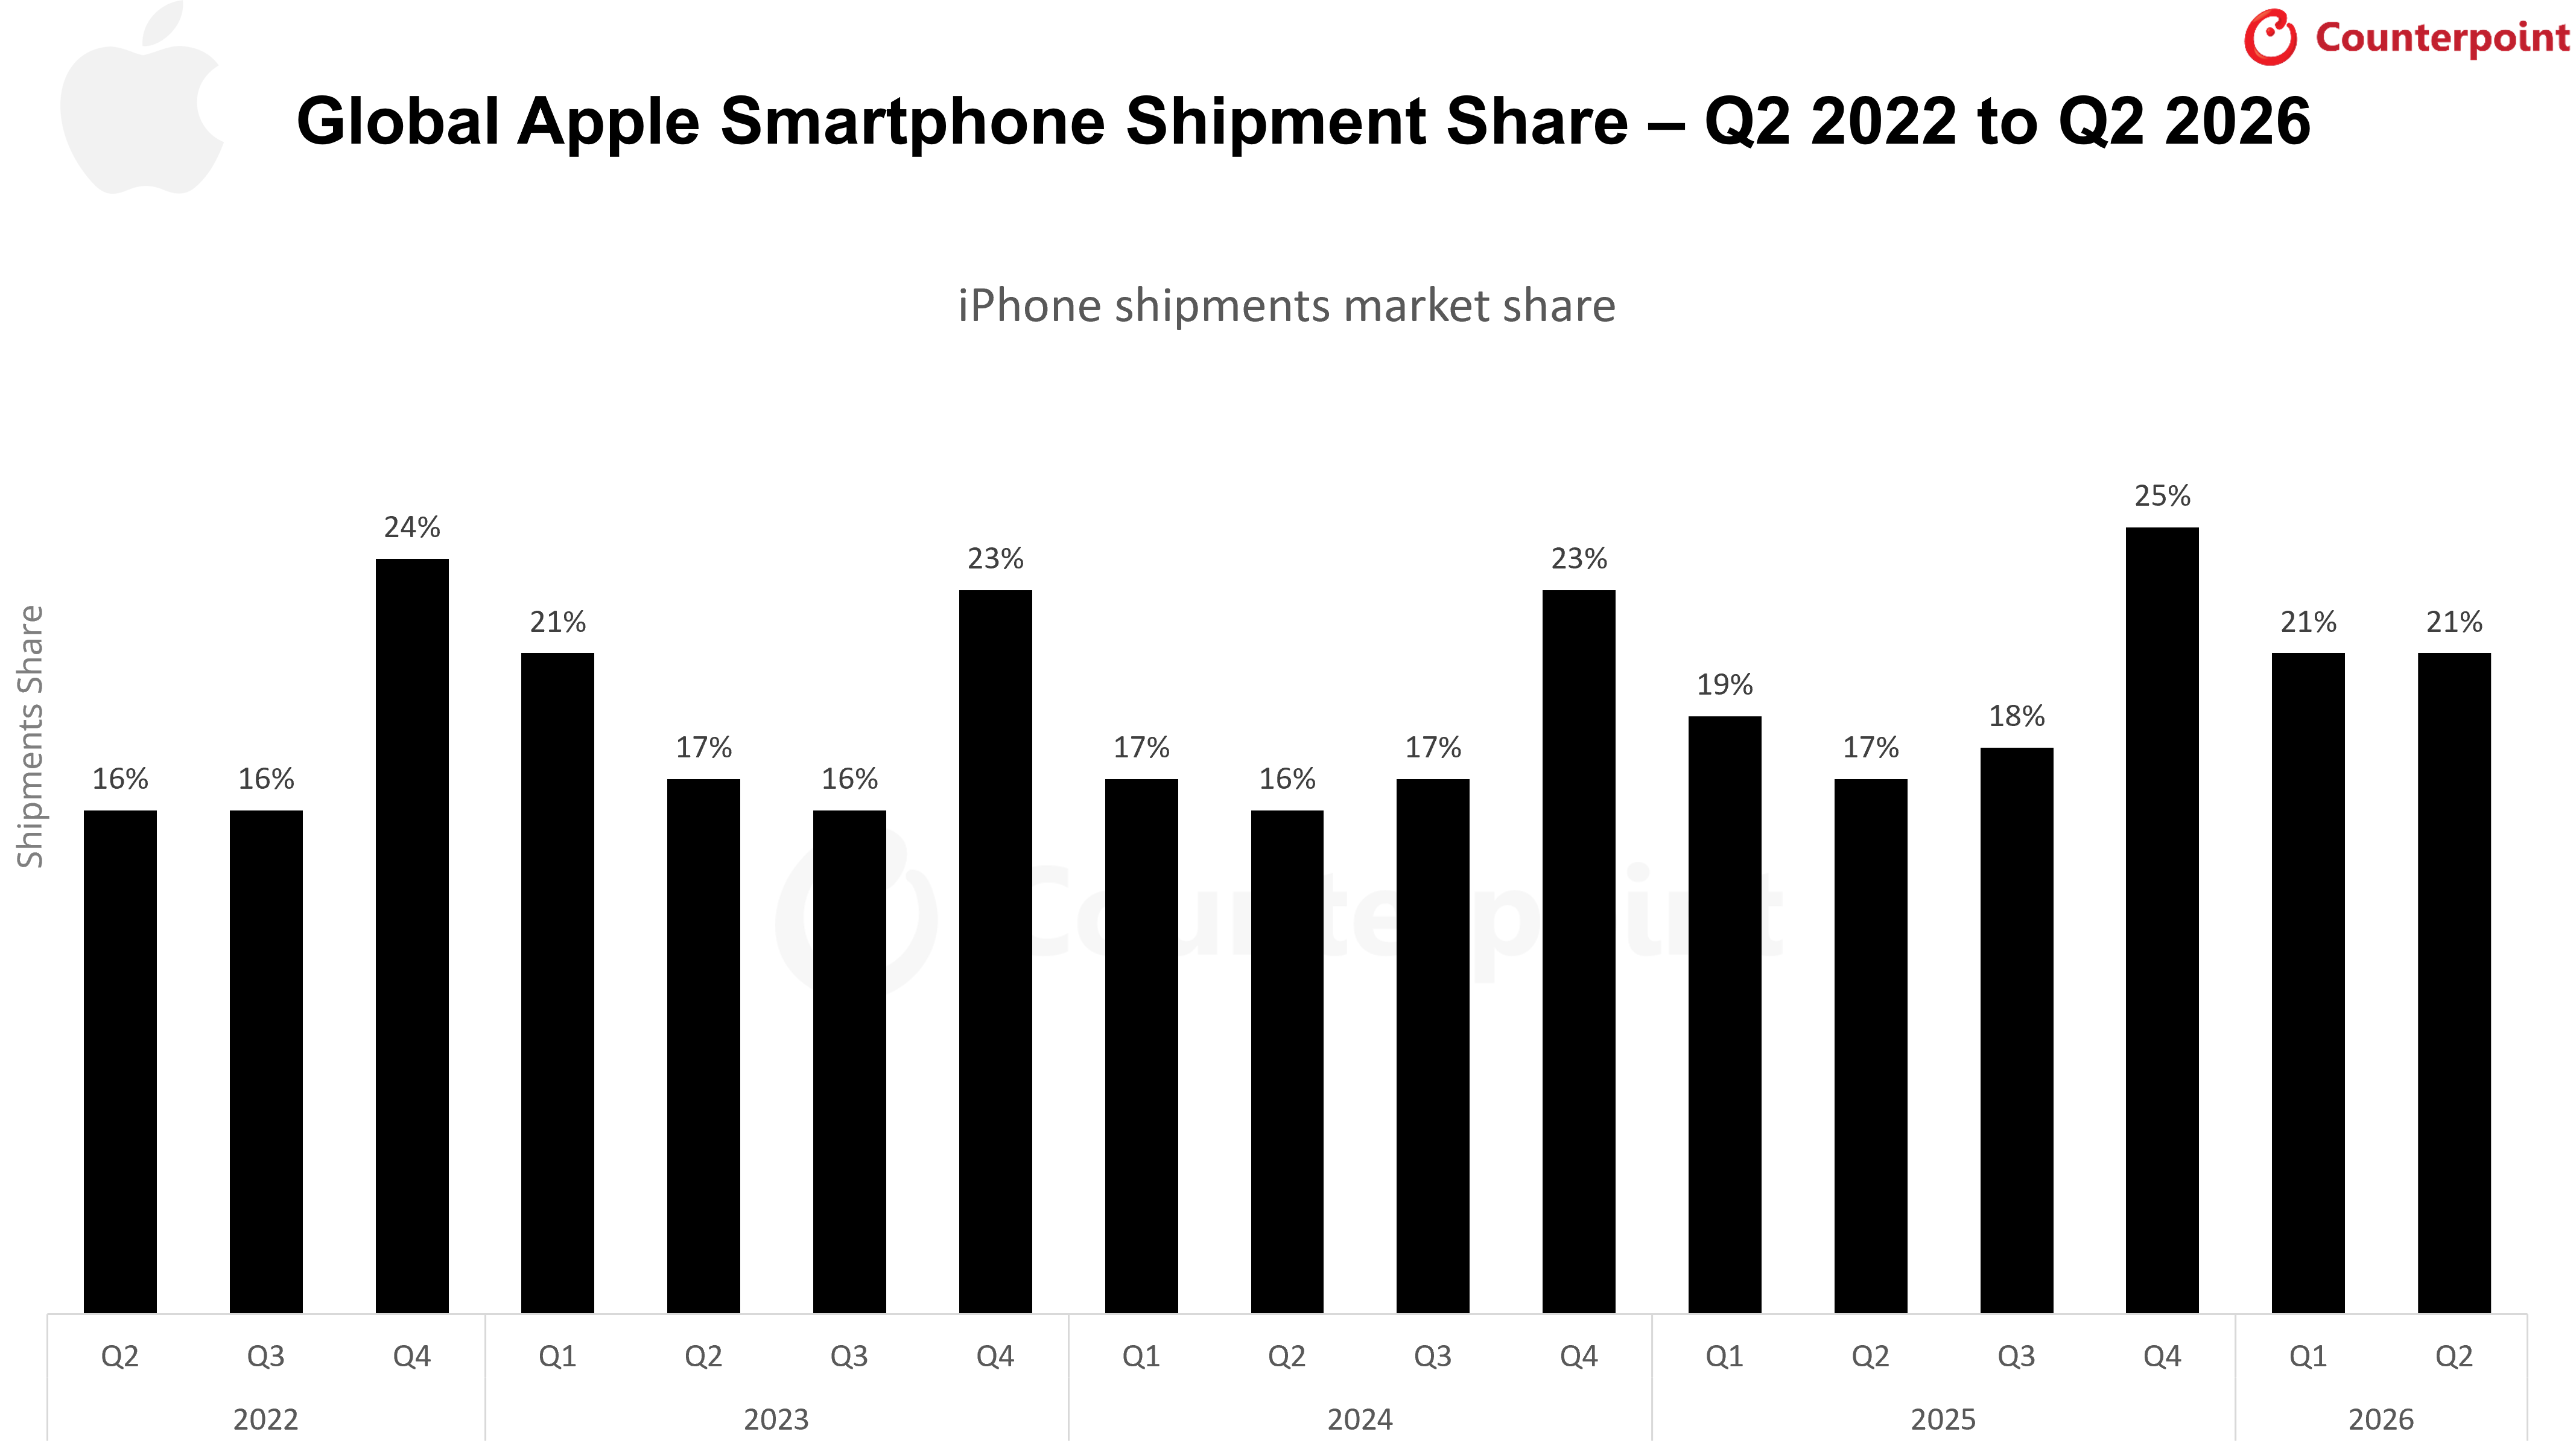
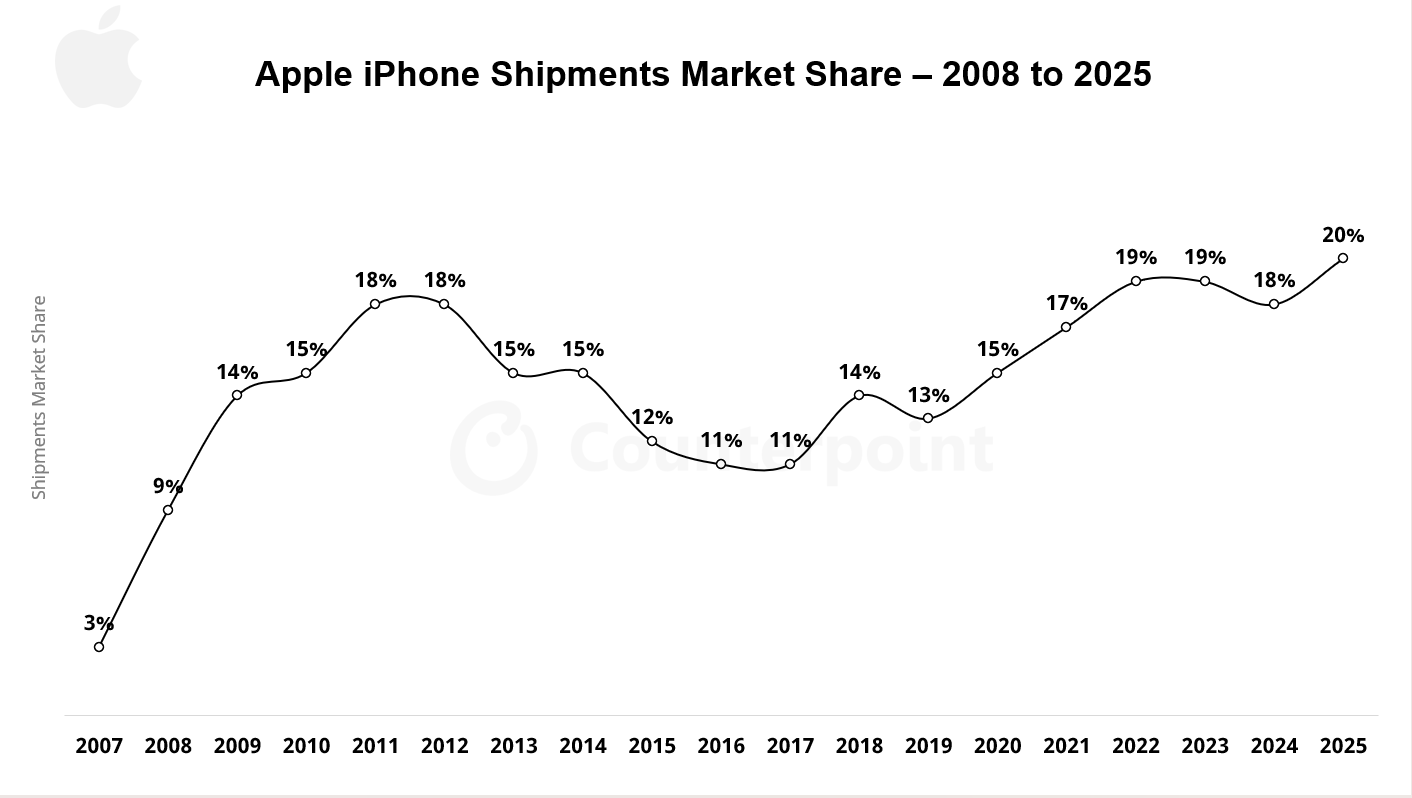
Apple witnessed strong shipment growth of 13% YoY in Q2 2026, driven by the continued momentum of the iPhone 17 series, stable pricing and higher shipments as the brand focused on gaining market share.
Apple outperformed the broader smartphone market in China, with shipments growing 23% YoY in Q2 2026. Stable iPhone pricing made iPhones more attractive as Android OEMs raised prices amid higher component costs, while expectations of higher iPhone prices in Q3 2026 also brought forward some purchases of the iPhone 17 series.
The USA continued to be Apple's largest market, recording 6% YoY shipment growth in Q2 2026, supported by stronger carrier promotions for the iPhone 17 Pro and Pro Max, with T-Mobile and AT&T offering trade-in subsidies of up to $1,100, compared with $1,000 a year earlier. Apple also expanded its focus on the iPhone 16e and 17e in prepaid channels, while the higher pricing of the iPhone 17 Pro shifted the market mix toward the $1,000+ segment.
Europe recorded 22% YoY shipment growth in Q2 2026, with growth across both Western and Eastern European markets. Apple's communication around potential price increases encouraged some consumers to bring forward purchase decisions, providing additional support to shipments during the quarter.
India was the only key market to register a YoY decline of 0.4% in Q2 2026, primarily due to persistent supply constraints and inventory shortages across both online and offline channels. Limited availability of key iPhone models constrained Apple's shipments during the quarter.
South Korea recorded Apple's strongest YoY shipment growth of 35% in Q2 2026, driven by stronger iPhone sales in April and May, when Apple outperformed the broader Korean smartphone market. The growth was also supported by a lower comparison base in Q2 2025 and promotional activity that brought forward some replacement demand.
Japan recorded 6% YoY shipment growth in Q2 2026, driven by strong demand for the base-model iPhone 17. Higher consumer spending, supported by record summer bonuses, along with intensified carrier upgrade programs and promotional activity toward the end of the quarter, further supported Apple's shipments.
Apple's shipment growth remained broad-based across several emerging markets, with strong growth in Indonesia, Mexico, Turkey, and the UAE.
Counterpoint Research uniquely tracks both sell-in and sell-through of mobile handsets in the market, giving a broader perspective of the market dynamics. This report covers quarterly sell-in vs sell-through of Apple iPhone models along with average selling price (ASP). The report provides global iPhone shipment and sales by quarter helping clients to understand the demand/supply scenario for the individual models.
Receive our insightful weekly newsletter and stay ahead of the competition.
Author
Team Counterpoint
Counterpoint Research is a global industry and market research firm providing market data, intelligence, thought leadership and consulting across the technology ecosystem. We advise a diverse range of global clients spanning the supply chain – from chipmakers, component suppliers, manufacturers and software and application developers to service providers, channel players and investors. Our veteran team of analysts serve these clients through our offices located across the key innovation hubs, manufacturing clusters and commercial centers globally. Our analysts consistently engage with C-suite through to strategy, market intelligence, supply chain, R&D, product management, marketing, sales and others across the organization. Counterpoint’s key coverage areas: AI, Automotive, Cloud, Connectivity, Consumer Electronics, Displays, eSIM, IoT, Location Platforms, Macroeconomics, Manufacturing, Networks & Infra, Semiconductors, Smartphones and Wearables.