Display Fab Utilization Holds Firm, But Market Dynamics Are Shifting
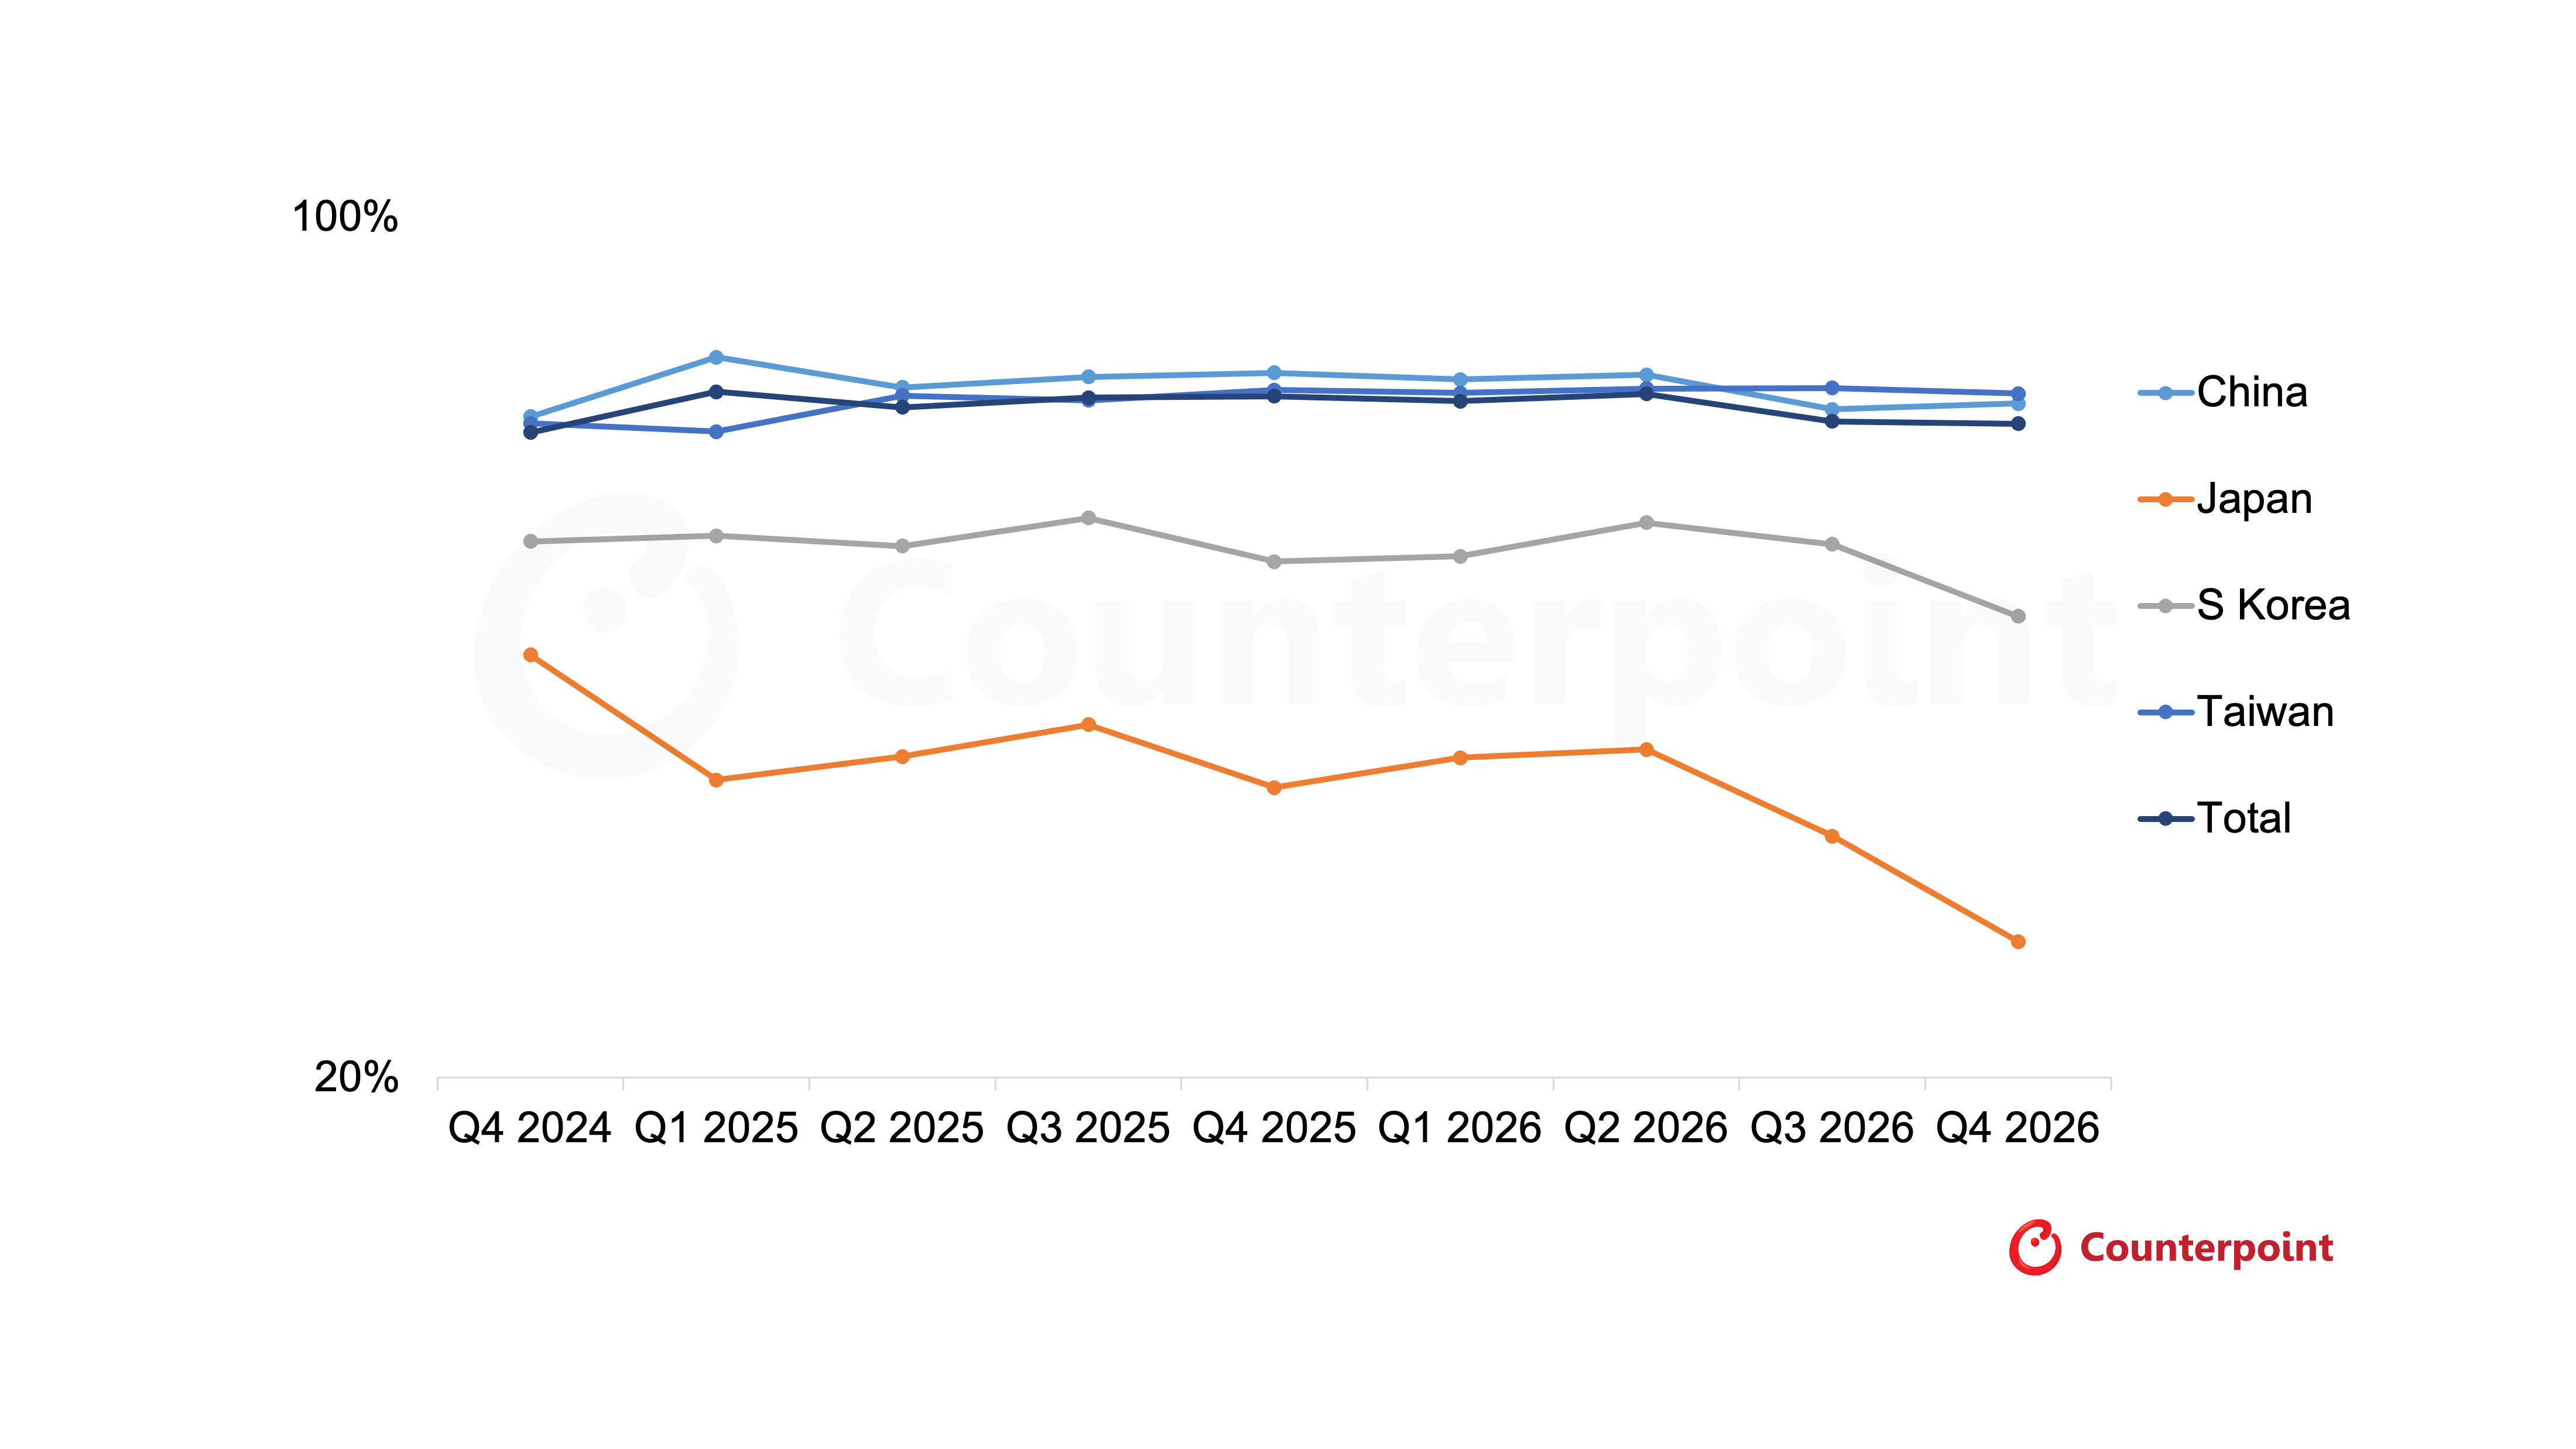
- China remains the industry's growth engine, accounting for nearly 75% of global TFT input area while maintaining utilization around 85% for six consecutive quarters.
- Japan's fab utilization is projected to decline from 50% in Q2 to only 33% by Q4 2026.
- Despite maintaining technology leadership in OLED capacity, South Korean utilization remains well below Chinese levels as manufacturers continue balancing premium smartphone demand, OLED TV production and future IT OLED capacity.
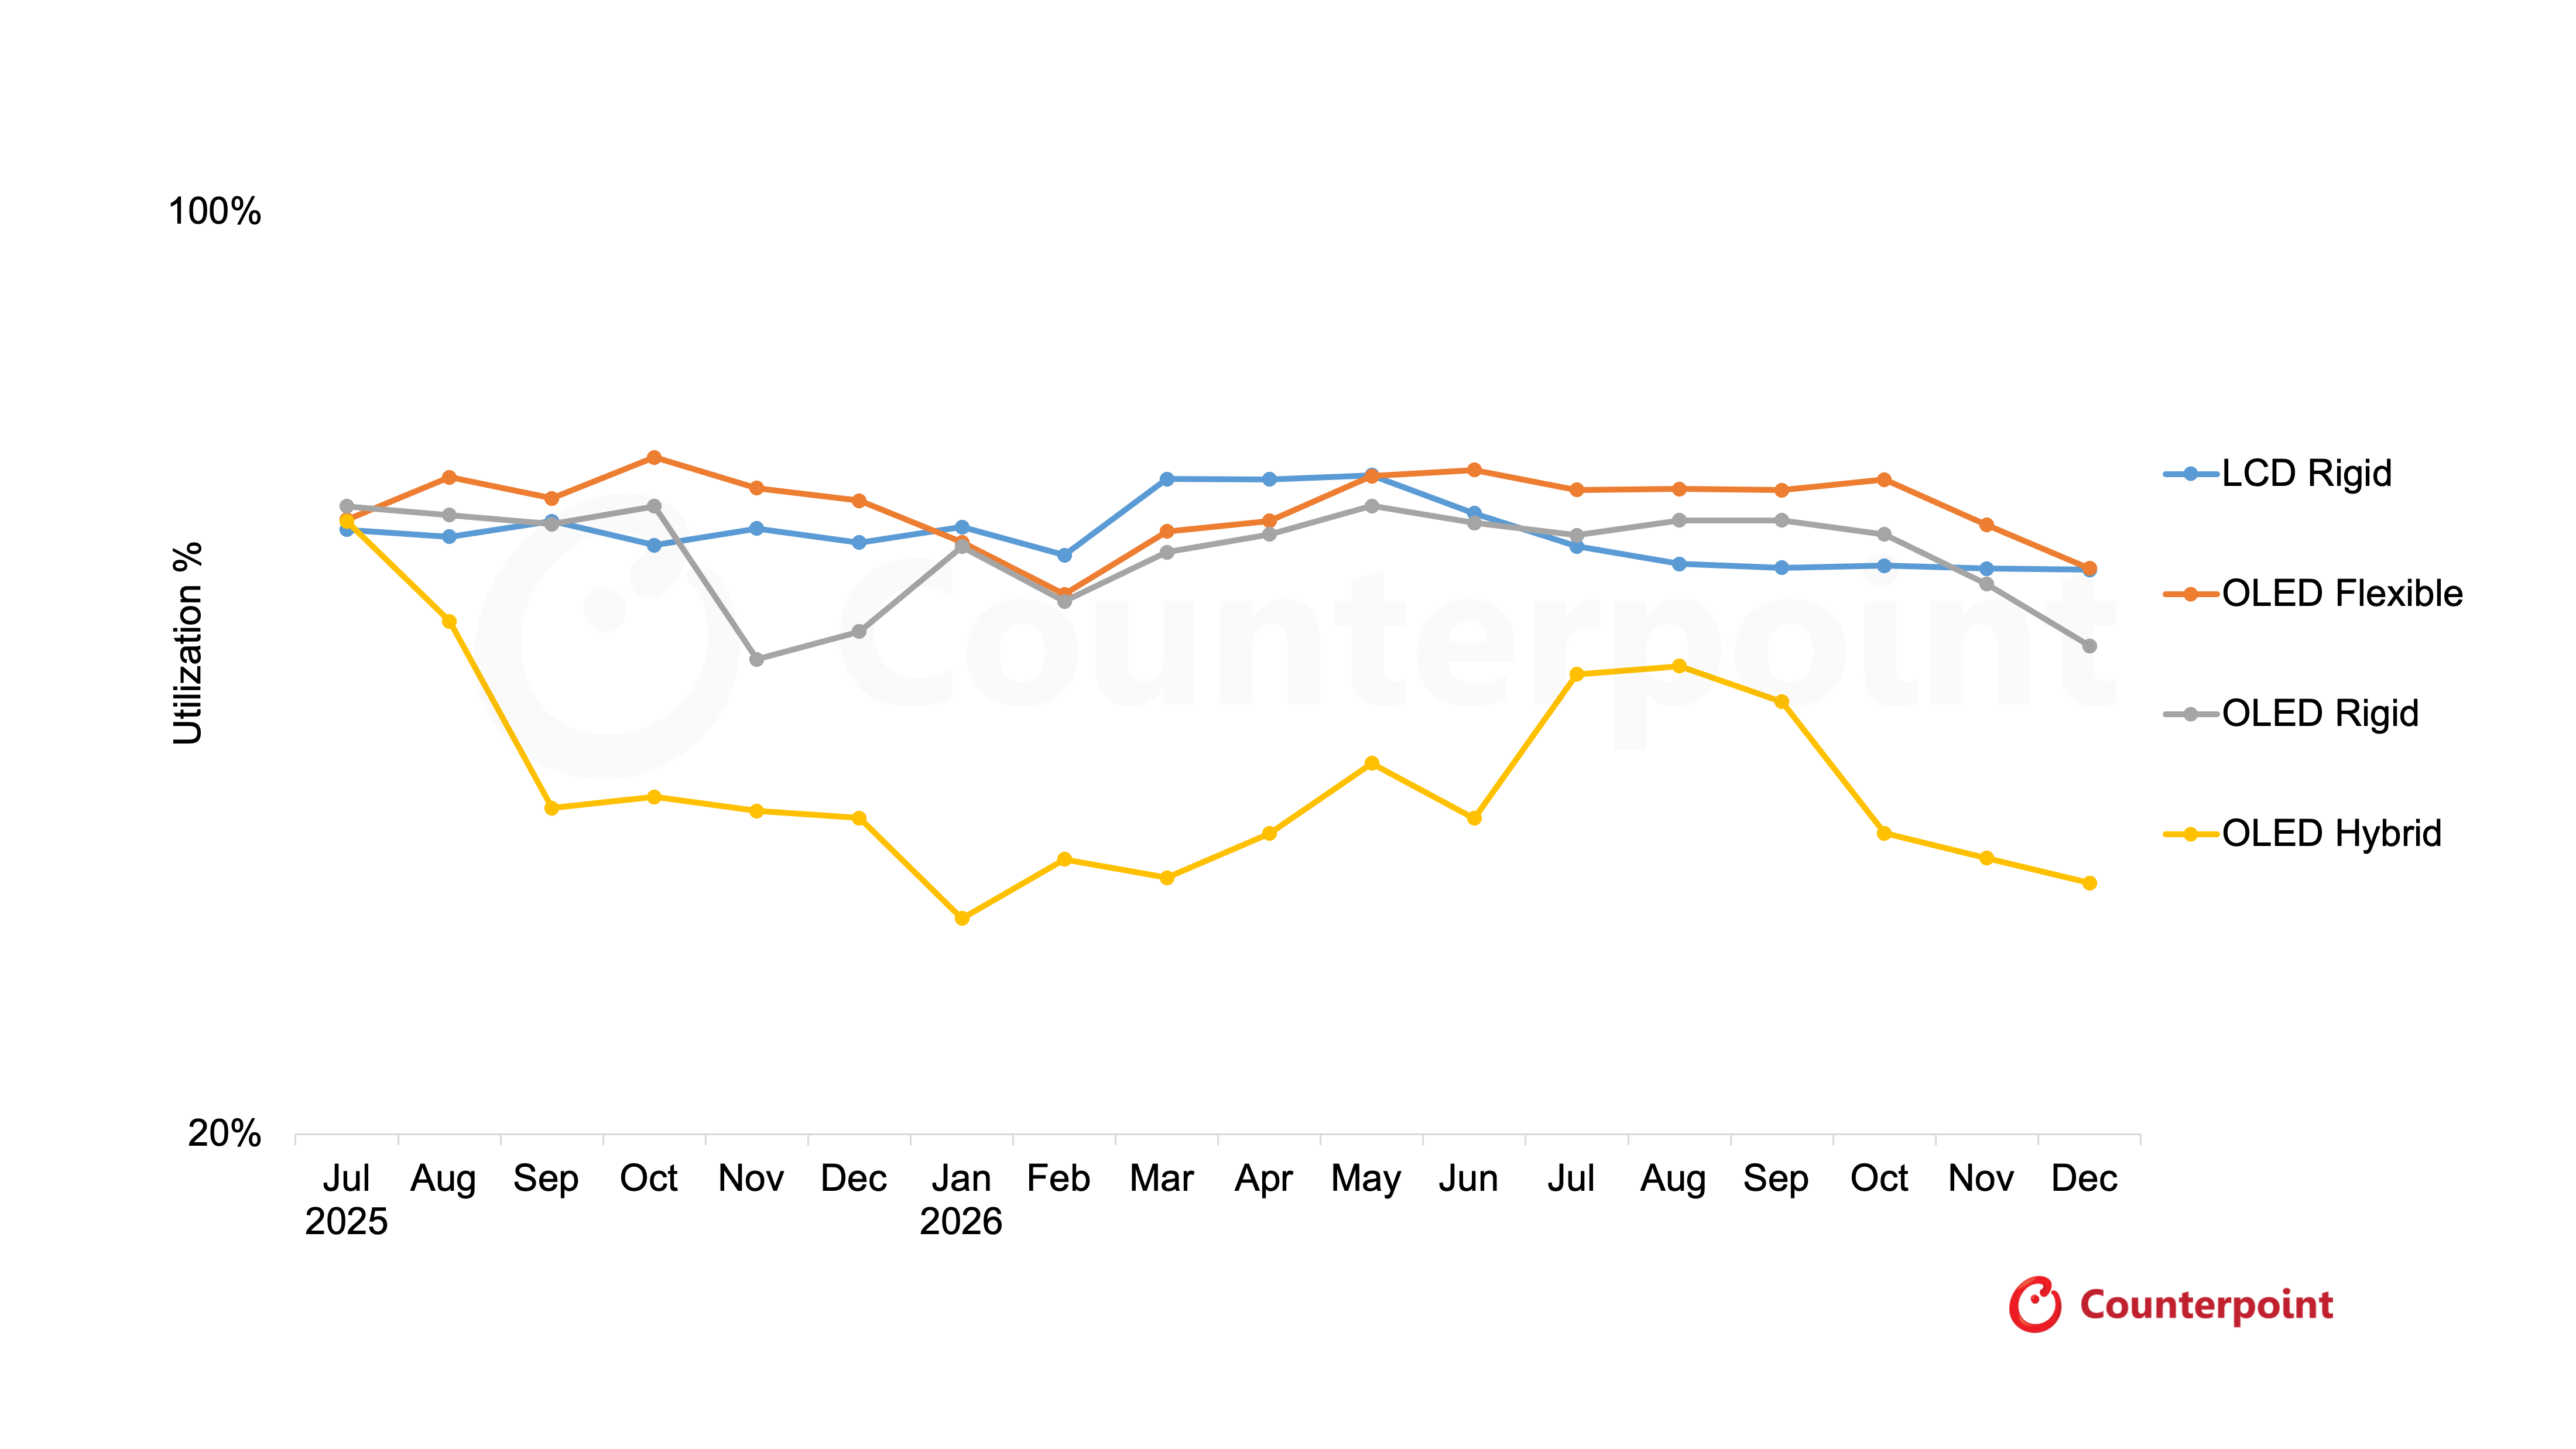
- Strong flagship smartphone launches, increasing LTPO penetration and continued premiumization are allowing flexible OLED fabs to sustain high utilization levels throughout 2026.
- a-Si/Oxide remains the strongest performer with utilization above 90%, while LTPO stays elevated at ~80% on strong premium smartphone demand. However, oxide backplane utilization remains volatile amid uneven IT display demand.
The global display industry entered Q2 2026 on relatively stable footing. Overall fab utilization improved to 84%, supported by disciplined production planning and resilient demand in smartphones and premium TVs. However, the data also reveals a growing regional divergence. While China continues to dictate industry momentum, Japan and South Korea face increasingly different structural challenges, and several display technologies are entering a period of correction. Here are our key takeaways from the latest All Display Fab Utilization Report and OLED and Mobile/IT LCD Fab Utilization Report.
Fab Utilization by Region, Q4 2024 – Q4 2026(F)
China continues to anchor the global display industry
China remains the industry's growth engine, accounting for nearly 75% of global TFT input area while maintaining utilization around 85% for six consecutive quarters.
Unlike previous years where utilization fluctuated sharply with demand cycles, Chinese panel makers have demonstrated much tighter supply discipline. A modest reduction to around 82% in Q3 appears to be a deliberate move to stabilize panel pricing rather than a sign of weakening competitiveness. This reflects a maturing industry where capacity management is becoming as important as capacity expansion.
The utilization gap between China and Japan is now structural
One of the clearest trends in the data is the widening regional gap. Japan's fab utilization is projected to decline from 50% in Q2 to only 33% by Q4 2026, accompanied by a major decline in TFT input area. This is no longer just a cyclical slowdown.
Several factors continue to pressure Japanese manufacturers:
- Aging Gen 4-6 LCD fabs
- Closure of OLED and LCD fabs like JDI Mobara and Sharp K2
- Limited investment in next-generation OLED capacity
- Increasing production concentration in China and Taiwan
Unless new investments emerge in specialized automotive or industrial displays, utilization is likely to remain under pressure.
South Korea's next challenge is optimizing OLED capacity
South Korea has already exited much of the LCD business, but OLED utilization tells a more interesting story. Despite maintaining technology leadership, South Korean utilization remains well below Chinese levels as manufacturers continue balancing premium smartphone demand, OLED TV production, and future IT OLED capacity.
With significant OLED investments already in place, capacity additions have temporarily outpaced end-market demand, resulting in utilization levels hovering around 68%-72%. The next utilization inflection will likely depend more on IT OLED adoption than smartphones.
Fab Utilization for OLED and Mobile LCD, July 2025 – Dec 2026(F)
Flexible OLED remains the industry’s utilization leader
Within OLED manufacturing, flexible OLED continues to operate at the highest utilization levels. Strong flagship smartphone launches, increasing LTPO penetration and continued premiumization are allowing flexible OLED fabs to sustain high loading throughout 2026.
Rigid and hybrid OLED utilization remains comparatively weaker as entry-level smartphone demand is growing more slowly.
Not all backplane technologies are following the same cycle
Looking only at overall utilization hides some important technology-specific shifts.
- a-Si/Oxide remains the strongest performer
This continues to be one of the healthiest manufacturing segments, with utilization consistently staying above 90%, supported by high-end TV production, large-size IT displays, and premium monitor demand. - LTPO continues operating at elevated utilization
LTPO utilization reached nearly 80% during Q2, supported by sustained demand for premium smartphones. As LTPO adoption expands across flagship and upper mid-range devices, panel makers continue to operate these lines at relatively high utilization levels. - Oxide backplanes remain volatile
Oxide utilization continues to fluctuate as notebook and monitor demand remains uneven. Until IT display demand broadens across end markets, oxide-based production is likely to remain more volatile than smartphone-focused OLED technologies.
Global TFT input is stabilizing rather than accelerating
After increasing to 88.4 million m² in Q2, total TFT input is expected to soften modestly during the second half. This reflects seasonal inventory normalization, planned utilization adjustments, and greater emphasis on maintaining panel pricing. Importantly, production reductions appear largely intentional rather than demand-driven.
The latest utilization data suggests the display industry has entered a more disciplined phase. Instead of maximizing production, panel makers are increasingly optimizing profitability through controlled capacity management.
Several themes stand out:
- China continues strengthening its manufacturing leadership.
- Japan's structural decline is accelerating.
- South Korea is transitioning toward an OLED-optimized production mix.
- LTPO and flexible OLED remain among the healthiest segments.
Perhaps the biggest takeaway is that utilization is no longer simply a measure of demand, it is a strategic pricing tool. Manufacturers appear increasingly willing to sacrifice short-term volume to preserve healthier industry economics.
The Quarterly All-Display Fab Utilization Report, as its name implies, covers every display technology and application, but a separate Counterpoint report, the Quarterly OLED and Mobile/IT Fab Utilization Report, provides a narrower focus on OLED and LTPS LCD for mobile devices and includes pivot tables to allow segmentation by supplier, country, TFT fab generation, backplane, frontplane or substrate type. Subscribers to this report can see the historical utilization of mobile devices back to Q1 2019 and a forecast by month through Q4 2026. Starting this year, Counterpoint has also introduced a monthly fab utilization report for more granular tracking of display industry trends.
Category
Industry
Display
Service
Display Fab Utilization
Report Type
Report
Time Period
Quarterly
Receive our insightful weekly newsletter and stay ahead of the competition.
Author
Nikhil Kishor
With a decade of experience in the display technology sector, Nikhil currently leads the Display 360 platform in India at Counterpoint Research, where he supports display industry clients through a combination of sales leadership, strategic consulting, and market intelligence. His expertise lies in cost modeling for display panels, supply chain analysis, and providing actionable insights across the smartphone, IT, and TV segments. Previously, he worked at Kearney, where he led cost-reduction strategies for display clients, and at Applied Materials as a Technical Lead – New Product Manufacturing Engineer, focusing on display fabrication equipment and supplier optimization.
Yoshio Tamura

Yoshio Tamura joined Counterpoint Research following its acquisition of DSCC, where he served as Co-Founder and President of Asian Operations at DSCC (Display Supply Chain Consultants), based in Tokyo, Japan. He has more than 30 years of experience in display market research and consulting and is widely recognized as one of the leading authorities in the display industry. He began covering the display market in 1991 at TSR, where he significantly expanded the company’s research activities in this field. In 2000, he was invited to join DisplaySearch and was later promoted to Senior Vice President. Through his strong industry relationships, DisplaySearch expanded its presence across Asia by recruiting top talent in Japan, Korea, Taiwan, and China. In 2005, DisplaySearch became the world’s leading display research company and was acquired by NPD (USA). In 2014, NPD’s DisplaySearch business was acquired by IHS (UK). In October 2016, he co-founded DSCC. In August 2023, DSCC was acquired by Counterpoint Research. He can be reached at [email protected]
Bob Obrien
Robert J (Bob) O’Brien joined Counterpoint Research as part of its acquisition of DSCC, where he was Co-Founder, Principal and CFO of DSCC. Bob has decades of experience turning market and business analysis into strategic insights in the display and electronics industries. At DSCC, Bob takes the lead role in analysis of display materials, including glass and AMOLED materials, and covers developments in TV and other large-screen display applications. He is the principal author of DSCC’s AMOLED Material Report, the Advanced TV Shipment Report, and the Display Glass Report, and Bob contributes regularly to the DSCC Weekly Review.